As Educational resources I have constructed different chemical speciation / solubility diagrams in Excel format.
1. Diagram pCation/pAnion
Also called “infinite dilution curve” or “evaporation curve”.
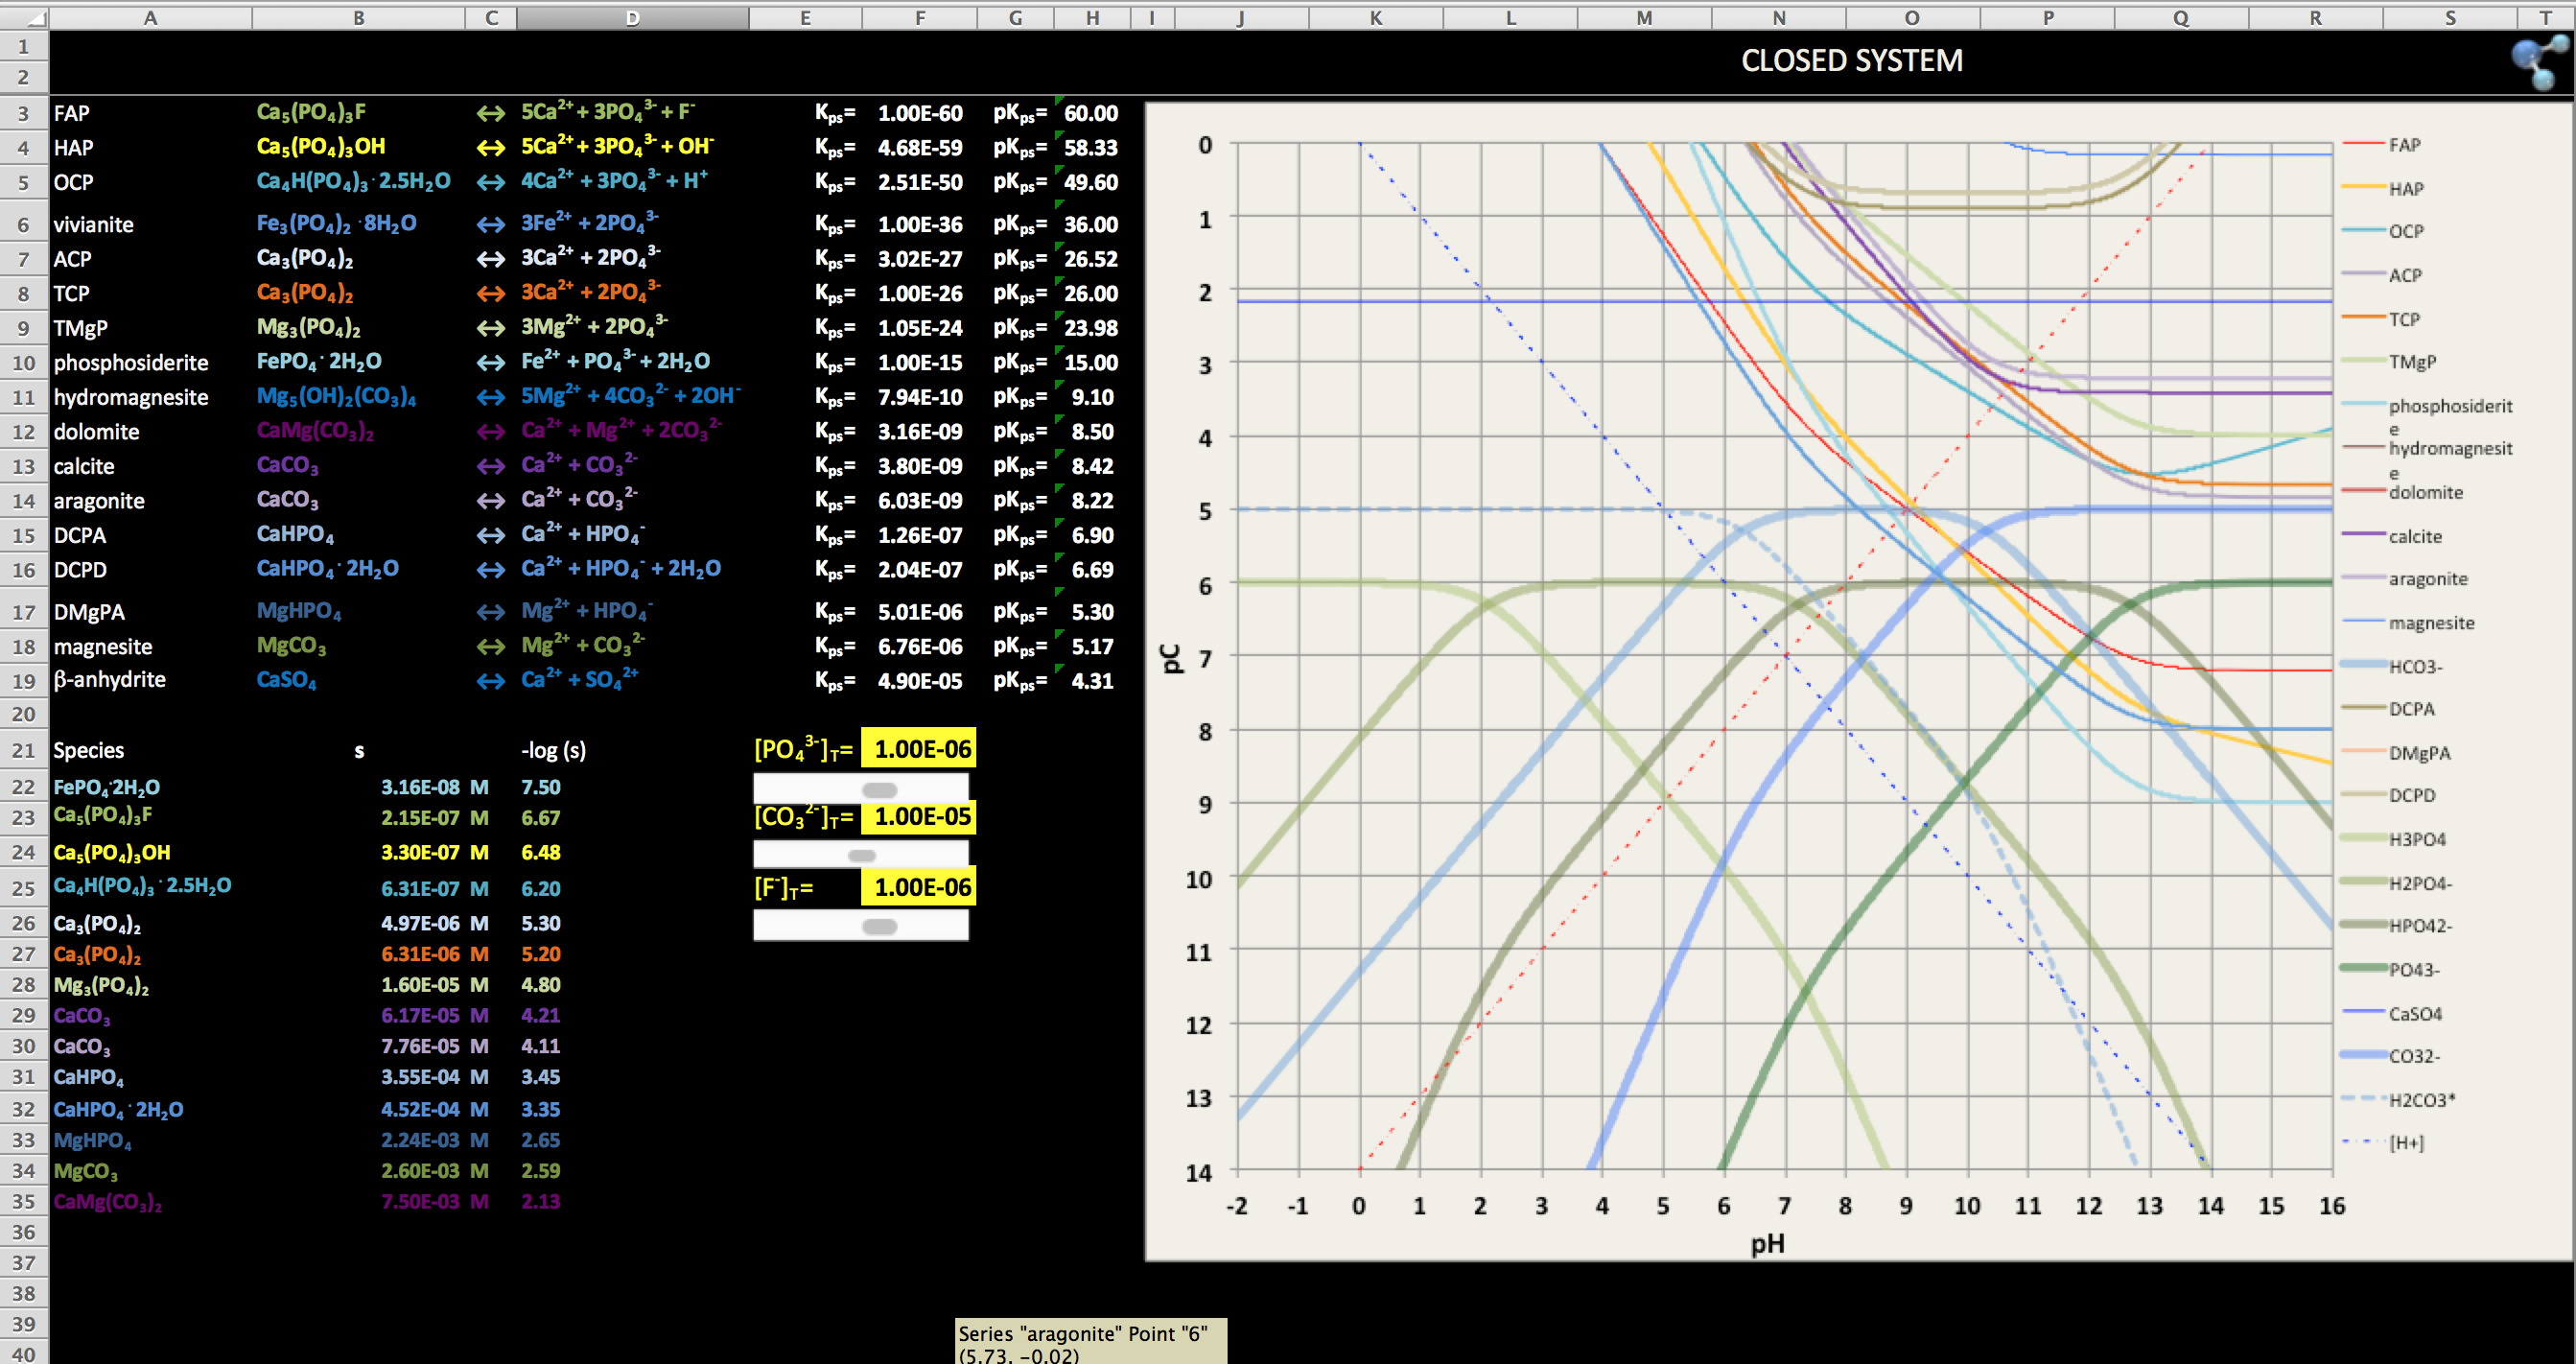
2. Diagram pC=f(pH)
a) Closed system
Solubility of major iron, phosphorous, calcium and magnesium compounds in a closed system as function of pH. Calculations based on Ksp values for freshwater. It is possible to set initial concentrations of different anions.
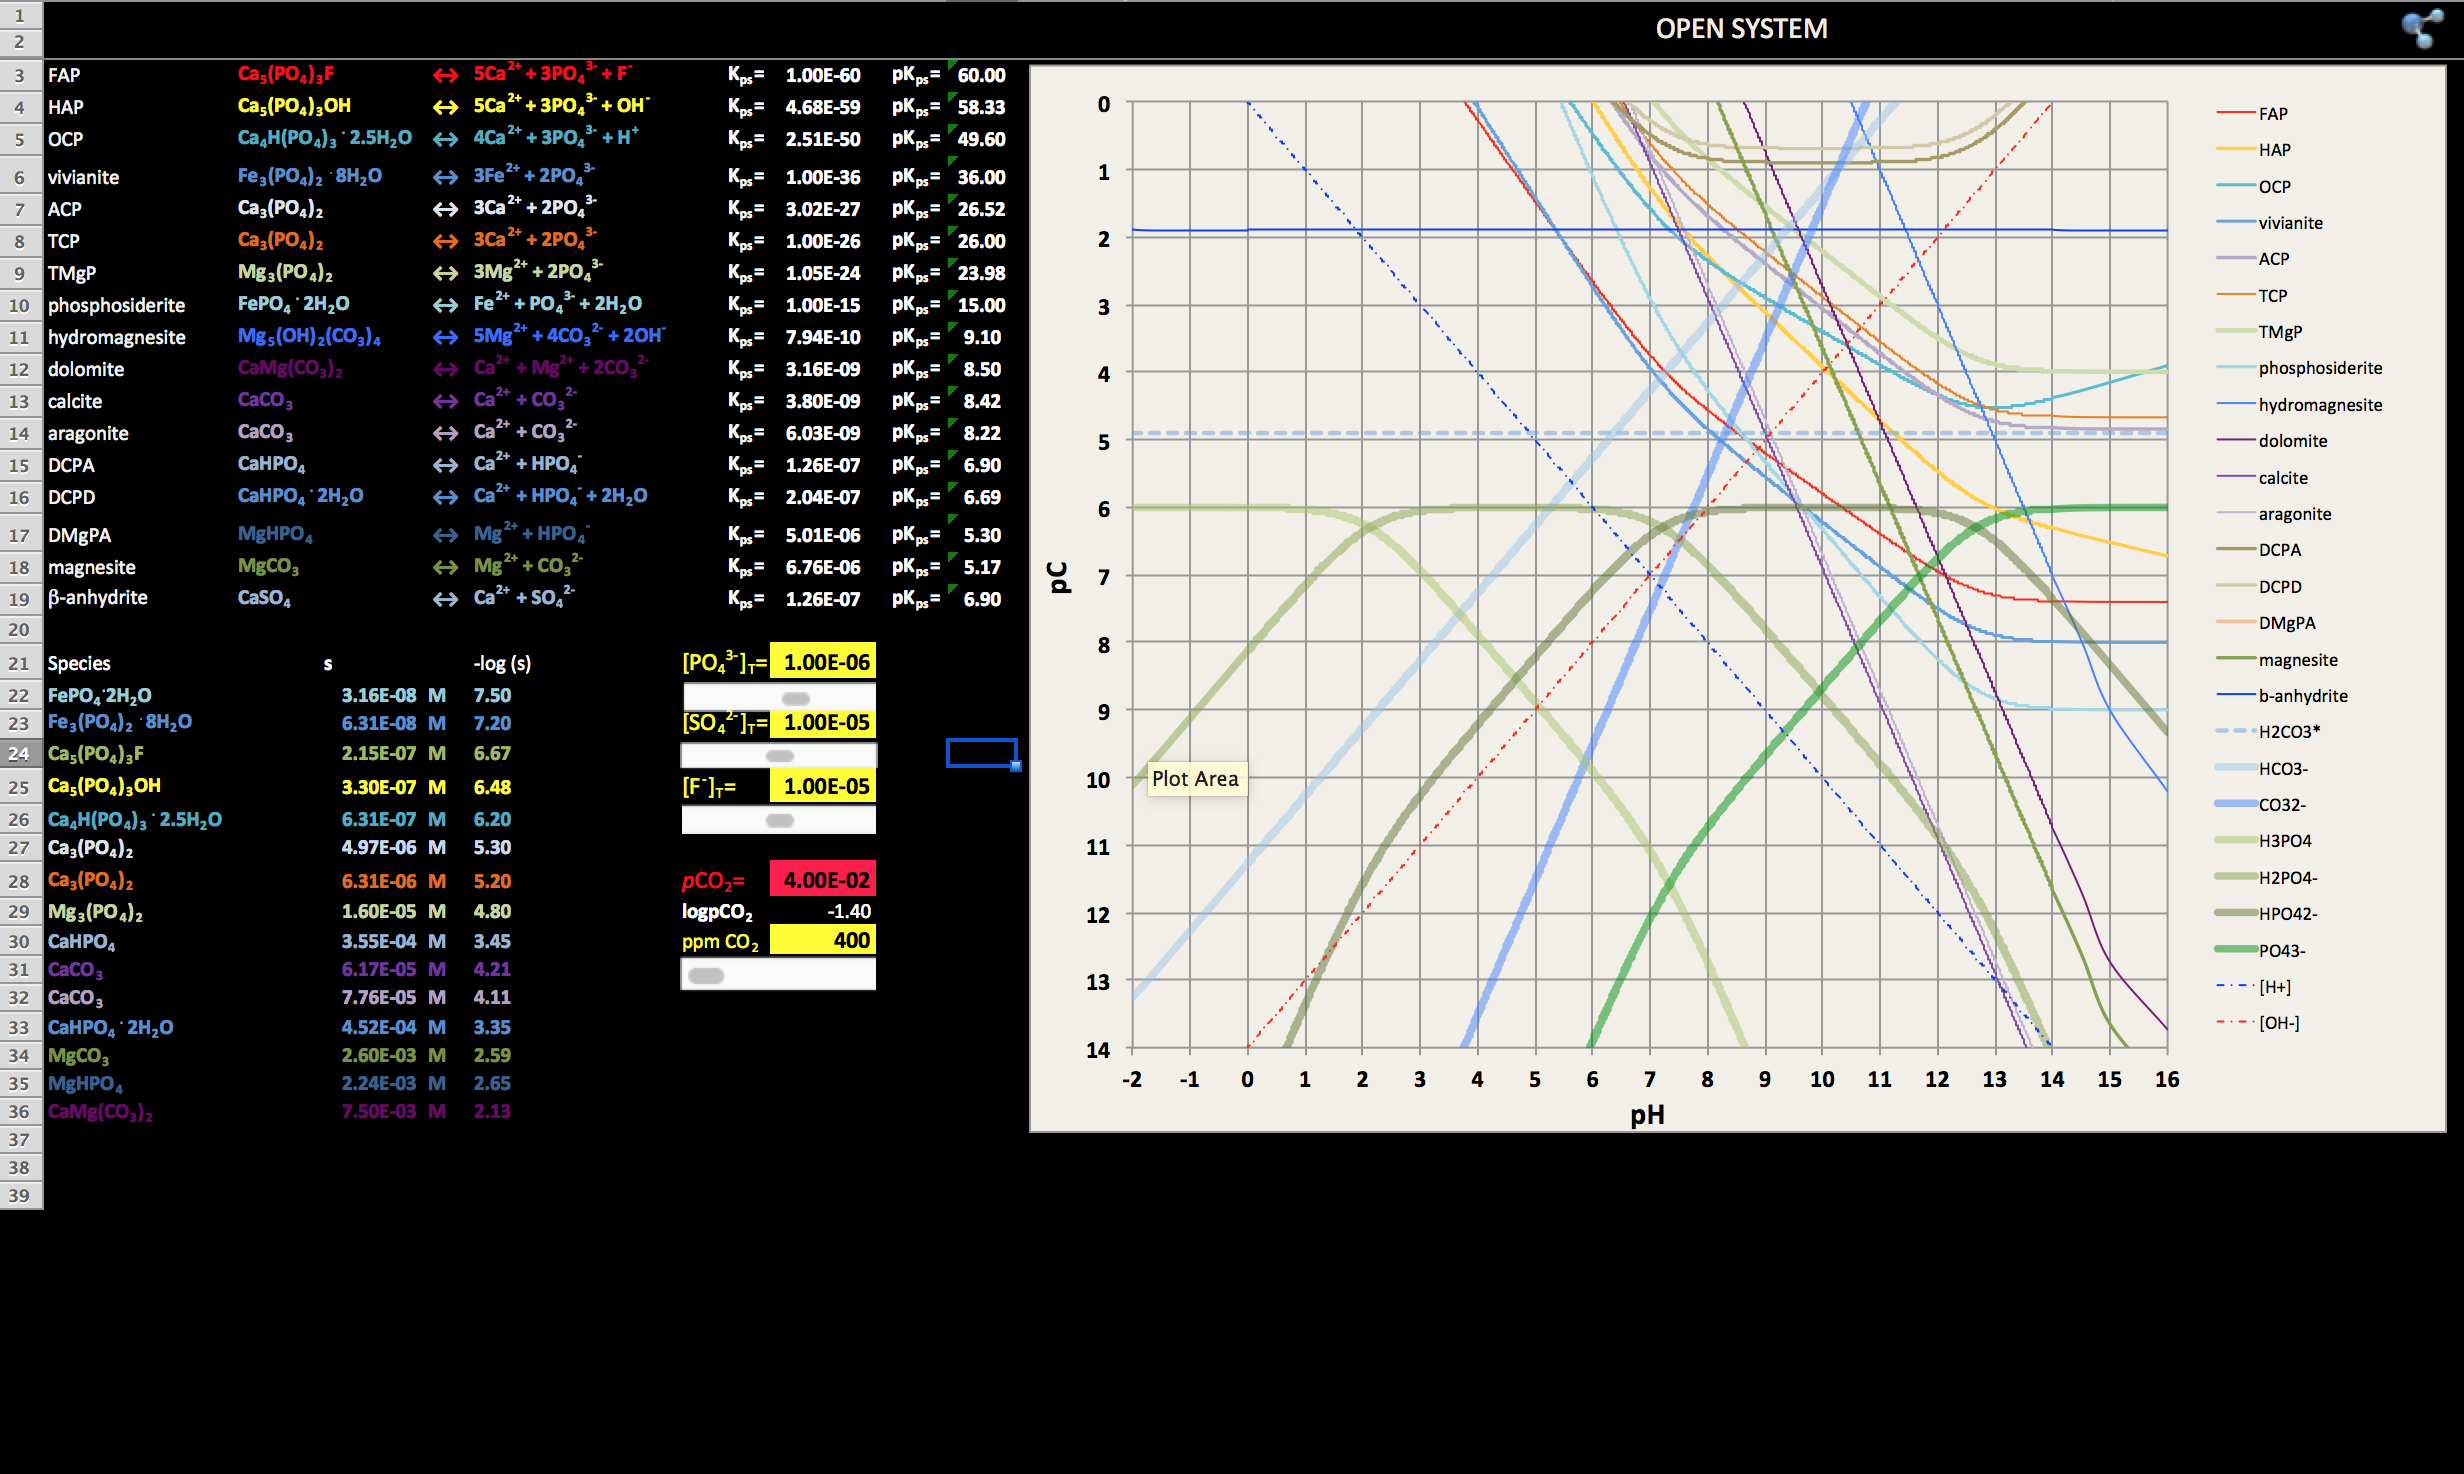
b) Open system
Solubility of major iron, phosphorous, calcium and magnesium compounds in natural aquatic systems as function of pH. Calculations based on Ksp values for freshwater. It is possible to set initial concentrations of different anions and pCO2 values