Earthquake hazard maps predict the maximum shaking expected at some probability in some time interval. Experience shows that although these maps are commonly made, they often fail to predict future earthquakes and what happens in them.
The problem is that making such maps involves assuming
– Where and when large earthquakes will occur
– How large they will be
– How much ground motion they will produce
These key parameters are poorly known and likely to remain so for many years, especially where large earthquakes are rare, so hazard maps depend on makers’ preconceptions and thus have considerable uncertainties.
A good way to see this is to compare maps made with different assumptions. For example, maps for the New Madrid seismic zone made for various assumed maximum magnitudes for the largest earthquakes and different models of the resulting ground motion predict hazards differing by factors of 2-3.
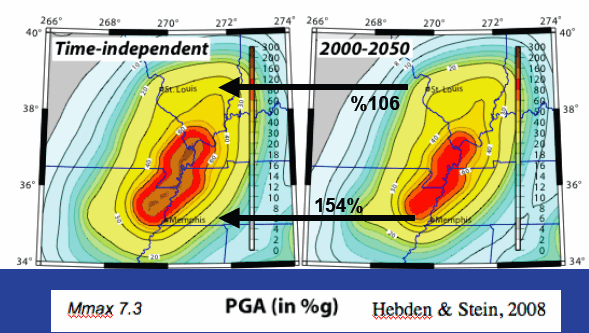
A second important choice is whether to assume that the probability of a major earthquake is either constant with time (time-independent) or small after a large earthquake and then increases (time-dependent). As shown, maps made with with different assumptions predict quite different hazards.
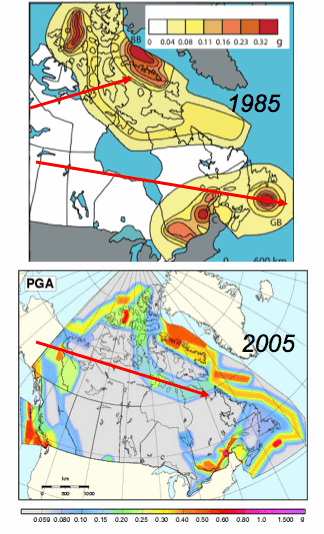
A third important choice is where to assume that big earthquakes will strike. The Geological Survey of Canada’s 1985 map assumed that future large earthquakes along the east coast would occur where past ones had, and so predicted concentrated hazard bull’s-eyes. In contrast, the 2005 map assumed a more diffuse hazard along the coast, and so had very different predictions.
 |
 |
 |
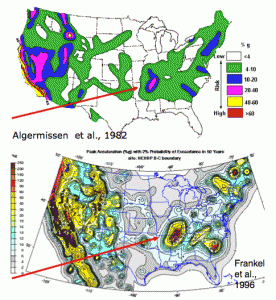
Another key feature is how to define the earthquake hazard. This effect is illustrated by the difference between the 1982 and 1996 USGS maps. The earlier map used the maximum acceleration predicted at 10% probability in 50 years, or about once on average in 500 years. The later one used the maximum predicted at 2% probability in 50 years, or about once on average in 2500 years. The earlier map thus predicted that New Madrid is much less hazardous than California, whereas the newer one made New Madrid as hazardous than California.
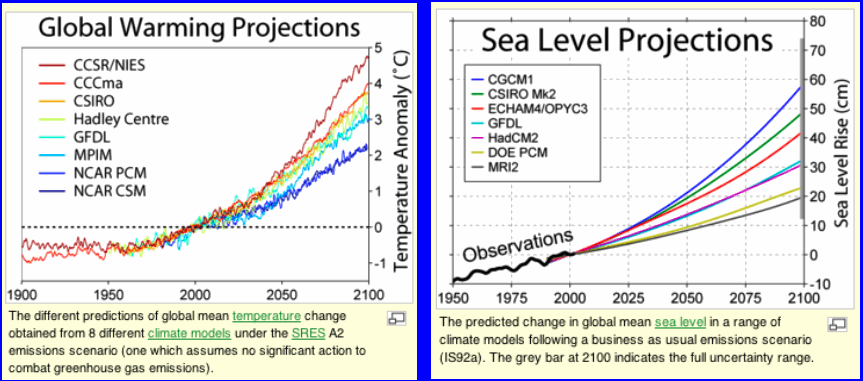
A good way to present such uncertainties is that used by the Intergovernmental Panel on Climate Change, who compare the predictions of a range of models and discuss their uncertainties, as shown by the example below.
Similar things can be done with hazard map predictions, as shown.
What causes these uncertainties?
 |
 |
References:
A. Newman, J. Schneider, S. Stein, and A. Mendez, Uncertainties in seismic hazard maps for the New Madrid Seismic Zone, Seis. Res. Lett., 72, 653-667, 2001.
Stein, S. and A. Newman, Characteristic and uncharacteristic earthquakes as possible artifacts: applications to the New Madrid and Wabash seismic zones, Seis. Res. Lett., 75, 173-187, 2004.
Stein, S., A. Friedrich, and A. Newman, Dependence of possible characteristic earthquakes on spatial sampling: illustration for the Wasatch seismic zone, Utah, Seis. Res. Lett., 76, 432-436, 2005.
Swafford, L. and S. Stein, Limitations of the short earthquake record for seismicity and seismic hazard studies, in Continental Intraplate Earthquakes, Special Paper 425, 49-58, S. Stein and S. Mazzotti, eds., GSA, Boulder, CO, 2007.
Stein, S. and J. Hebden, Time-dependent seismic hazard maps for the New Madrid seismic zone and Charleston, South Carolina areas, Seis. Res. Lett., 80, 12-20, 2009.
