An important issue for trying to assess the hazard due to possible future large earthquakes in New Madrid seismic zone in the central US is how to estimate the probability of such earthquakes. Estimating earthquake probabilities is a hard thing to do anywhere, and especially hard here, because the earthquake history is short. As a result, different approaches can give values that vary considerably, and there’s no compelling reason to regard any one as better than the others. Understanding how this comes about gives a feel for the uncertainties involved.
The real concern is large earthquakes like those that occurred in 1811 and 1812. These magnitude 7 earthquakes that caused shaking across a large area. Most of the area, places like St. Louis, Louisville and Nashville, had only minor damage, typically a few fallen chimneys. However, if large earthquakes like those occurred again, they could be very destructive.
 The starting part in assessing the probability that such events may occur again is geological data, summarized in the figure to the right, that are interpreted as showing ground liquified by earlier earthquakes, possibly similar to those of 1811-12. Although each observation has an uncertainty in its estimated age, the data taken collectively have been interpreted as showing that large earthquakes occurred in 1450 +/- 150 AD, 900 +/- 100 AD, and 490 +/- 50 AD (Tuttle, 2001).
These values and their inferred uncertainties can be used in various ways to estimate how often large earthquakes have occurred. The simplest is to treat them as showing that large earthquakes recur on average 440 years apart with a standard deviation of 147 years.
If we assume that this pattern will continue, we can calculate the probability of another large earthquake in a given time period. This can be done in different ways, each of which gives different numbers.
The simplest is to assume that recurrence of large earthquakes is described by a time-independent process, such that a future earthquake is equally likely immediately after the past one and much later. The probability that an earthquake will occur in the next t years is approximately t/T, where T is the assumed average recurrence time. Such processes, that have no “memory,” called Poisson processes. For example, this is the approach used to calculate hurricane probabilities.
An alternative is to assume that earthquakes follow a cycle in which strain builds up on a fault after an earthquake and eventually causes the next one. the time between earthquakes. In such models the probability of the next large earthquake is small shortly after the past one, and then increases with time. A variety of such time-dependent models have been used in earthquake studies. The simplest assume that the recurrence times are distributed acording to the familar “normal” or “bell” curve, with the average value being the most likely and values being less likely the further they are from the average. Assuming that either the values themselves or their logarithms are distributed this way give what are known as Gaussian or lognormal distributions.
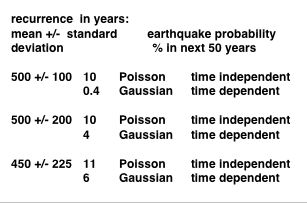
Thus the probability of a large earthquake we estimate depends on the model we chose and the values we chose for the mean and standard deviation of the recurrence times. Most choices give values between 0 and 10%. Since we’re less than halfway into the average recurrence time, the time-dependent models give lower values. For example:
All these calculations assume that the recent cluster of earthquakes will continue. If the fault is “shutting down” and the recent cluster is ending, then it may be much longer – if ever – before a large earthquake recurs.
In summary, earthquake probabilities have large uncertainties. Thus has been suggested (Savage, 1991) that it is only meaningful to quote probabilities in broad ranges, such as low (<10%), intermediate (10-90%), or high (>90%).
A good way to get a feel for the challenge of estimating the probability and its uncertainty to is to try various values. The spreadsheet linked below calculates the probability of an earthquake for different models given the date of the last earthquake, a time window, and the assumed mean and standard deviation of recurrence times.
Download introduction to earthquake probabilities (pdf) from Stein & Wysession, section 4.7.3
References
Stein, S. and J. Hebden, Time-dependent seismic hazard maps for the New Madrid seismic zone and Charleston, South Carolina areas, Seis. Res. Lett., 80 , 10-20, 2009. For pdf click here
S. Stein & M. Wysession, Introduction to Seismology, Earthquakes, & Earth Structure , Blackwell, 2002
Savage, J. C., Criticism of some forecasts of the national earthquake prediction council, Bull. Seismol. Soc. Am., 81, 862-881, 1991.
Tuttle, M. P., The use of liquefaction features in paleoseismology: lessons learned in the New Madrid seismic zone, central U.S., J. Seismol., v. 5, 361-380. 2001.

