Authors: Alex Barbatsis, Isaac Rhee, Jimmy Zhang
Alexbarbatsis2026@u.northwestern.edu, isaacrhee2027@u.northwestern.edu, jimmyzhang2027@u.northwestern.edu
Although far from an exact science, projecting and drafting future NFL stars is a process that can be optimized and lead to franchise success on and off the field. In a league that often validates the “Not For Long” mantra, GM and coaching staff jobs are tied to the immediate success of their rosters, which usually depends on the strength of the quarterback position. For this reason, many front offices each year have to ask difficult questions about their signal-caller situation and address these concerns in the free agent market or draft. In a year with a deep quarterback draft class and a growing list of QB-needy teams, we wanted to analyze trends and build a model that would allow teams to make their evaluations and decisions more efficiently.
Starting with only a simple linear analysis of career statistics, we found very minimal correlations between college and NFL stat outputs in AY/A and TD/Int ratio. However, completion percentage is one metric that seems to translate between the levels. This is because passing profiles (taking shots down the field versus check-downs) and decision-making remain relatively consistent throughout a player’s career. Major fluctuations in completion percentages largely stem from scheme switches, as systems like the Shanahan offense prioritize quick routes and screen passes, inflating the quarterback’s completion percentage. On the other hand, offenses like Seattle’s incorporate many deep passing concepts, leading to lower completion percentages and more interceptions. It can be difficult to separate a quarterback’s skillset from the scheme he plays in, which is why we see a wide range of prototypes succeed or fail in different situations.
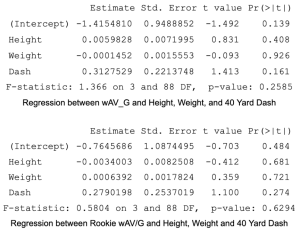
While starting to build out a Machine Learning model to gain a more comprehensive look at trends between college and professional stats, we wanted to first look at the comparison of physical measurables to professional success. At combines and pro days leading up to the draft, prospects’ height, weight, and 40-yard draft time are recorded to build a basic athletic profile. While these numbers may not give us a great picture of on-field production, they can be useful in profiling the durability of a prospect in a league that is much bigger, stronger, and faster than even the pinnacle of college football. For this, we built out a simple model that only uses height, weight, and 40-time to project NFL QB rating, which will serve as the response variable in all of our model testing. There is no perfect single measurement that captures quarterback success in the NFL, and QB Rating serves as a good parameter that is easy to comprehend and consistently represents overall performance year-over-year. When just looking at these physical predictors, we found that height is a statistically significant predictor of our response, as the P>|t| value is less than 0.05, which is the threshold for a 95% confidence level. This is interesting because it is a confirmation of the narrative that circulates close to the draft day that short quarterbacks are generally riskier investments. Although we have only seen one season’s worth of games within a mediocre offensive system, it could be pointed out that Bryce Young’s height at 5-10 is a hindering factor to his potential for success in the league. The top quarterbacks this year all pass the height test, and it is particularly enticing that the two tallest, Jayden Daniels (LSU) and Drake Maye (UNC), also possess some of the fastest 40 times in the class as well.

After taking a look at physical metrics, we wanted to build out a more complex model that compared the college careers’ of active NFL QBs and their professional statistics so far. For this, we looked at some more telling statistics collected in college football, air yards per attempt, and TD/Int ratio and compared these to the active NFL QBs’ college stats. These are solely stats from the quarterbacks’ last year of college, which is the most recent snapshot front offices have before they make their draft picks. The model results, shown on the right, display a more well-rounded look at what stats are important in evaluating quarterbacks. Here we see that completion percentage (“Comp”) is a great predictor of future QB rating and seems to translate between levels of football. Also, although they technically wouldn’t be considered statistically significant, TD/INT, air yards per attempt, and yards per attempt all have fairly low p-values and contribute to a more successful model. We can also see that the model as a whole is a significant tool in making this forecast, as the p-value of the f-statistic is much lower than 0.05. This model was then implemented on a test set of current college QB data to make a regression prediction for NFL QB rating. This prediction yielded the following table, sorted by the response column on the right:
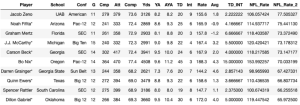
There is a bit of noise in this outcome that must be considered, as the model predictions reward outstanding statistical performances regardless of conference or other factors. In the context of this analysis, we should only focus on J.J. McCarthy (Michigan), Bo Nix (Oregon), and Spencer Rattler (South Carolina), who are all slated to get drafted in April. Each put up highly efficient seasons in these key metrics, which isn’t a requirement for professional success but is a plus. These names can all be seen as safe pickups for teams as a large emphasis is placed on avoiding turnovers and taking care of the football. Teams with established offensive systems and talent at the skill positions, such as the Vikings, will likely have their eyes on this crop of players.

The final model we constructed looked at both physical and performance metrics to forecast future NFL success. The model considered the complete college careers of current NFL quarterbacks and those about to get drafted. Once again, height and completion percentage were shown to be accurate predictors of future success in the league. This once again rewarded Nix, who appeared third in the rankings that the model predicted based on the imputed profiles. Also not surprising was the presence of Caleb Williams (USC), who excels in any performance metric or test and should get drafted first overall. The model was not as high on Drake Maye as many are, largely due to a lower completion percentage and a somewhat disappointing 2023 season. His physical profile is hard to ignore and is what will lead to him likely getting drafted 2nd overall. Maye put up a much better statistical season in 2022, which gives scouts much more security in his on-field production prospects. Overall, models should not be looked at as the end-all-be-all for quarterback evaluations, as there are still countless other factors that are used to analyze the most important position in sports, like intelligence testing, film review, and character makeup. With that being said, organizations and fans can glean valuable information from these results, especially in terms of weeding out noisy metrics in favor of ones that are better predictors of future performance.
Analyzing the Draft
While so much focus is placed on analyzing the specific traits of each quarterback, another strong indicator of NFL success is found in the draft circumstances of a quarterback. In the last ten NFL drafts (2014-2023), 101 total quarterbacks were selected. Of those, the analysis focused on 38 who started a significant proportion of their team’s games, ignoring injury and other special circumstances.
Draft pedigree is naturally one of the best indicators of success, simply due to the greater opportunity that higher draft picks receive. There were a total of 32 quarterbacks selected in the first round, and 26 of them (81%) started enough games and were included in the data set. Conversely, only 7 of the 47 quarterbacks (15%) selected in the fourth round or later were included. While this fails to account for the career longevity some late-round selections experience as backup quarterbacks, it still shows the significantly greater opportunity for success that a high draft pedigree provides.
Within this narrowed data set, the quarterbacks were divided into three categories: primary starter as a rookie (PSR), a rookie making over 10 starts after beginning the season as a backup (R10), and primary backup as a rookie (PBR). Oftentimes, a general manager decides to draft a rookie quarterback to sit behind an established starter for one year, allowing them to learn the offense without the added pressure of starting from day one. This division of the quarterbacks accounted for such a rationale.
The success of each quarterback was quantified using their weighted career approximate value (wAV) according to Pro Football Reference. This was also divided by the number of starts each quarterback made to calculate an average value per game (APG), which offered a more consistent comparison between quarterbacks with significantly different amounts of games played. A higher APG corresponds to a greater value per game (calculated on a scale from 0-1). These metrics were calculated for each of the 38 selected quarterbacks, and comparisons were made both individually and between the three categories of quarterbacks.
The average APG of all 38 quarterbacks was 0.6859, calculated from the total wAV of all quarterbacks divided by the total number of starts. This value was used as a benchmark for an average-performing quarterback, which matched as expected with other indicators of career success. Five quarterbacks had an APG greater than 0.9, indicating an elite level of success (Patrick Mahomes: 1.000, Lamar Jackson: 0.9767, Brock Purdy: 0.9600, C.J. Stroud: 0.9333, Jalen Hurts: 0.9032). All five of these quarterbacks have been a valuable part of very successful teams, so the APG is a good indicator of quarterback success. Unsurprisingly, Patrick Mahomes had the highest APG, but the success in relatively smaller sample sizes for Brock Purdy and C.J. Stroud propelled them to high APGs as well.
Of these top five quarterbacks, four were in the PBR category, while C.J. Stroud was the only one in the PSR category (none from R10). This indicates that the quarterbacks selected in the PBR category generally experience greater success over their careers, and extending the data analysis to entire categories supports this conclusion. The average APG was the greatest in the PBR category by a significant margin, and lowest in R10 (PBR: 0.7623, PSR: 0.6838, R10: 0.6249). Additionally, the proportions of quarterbacks with above-average APG corresponded to this (6/12 in PBR, 5/12 in PSR, 3/14 in R10). These findings are summarized in Table 1, and Figures 1-3 show the APG for all 38 quarterbacks compared with the averages.

Table 1. The overall results from analyzing APG in all three quarterback categories.

Figure 1. The APG of 12 PBR quarterbacks from the past 10 NFL drafts. The APG for PBR quarterbacks and all quarterbacks is indicated with dotted lines.

Figure 2. The APG of 12 PSR quarterbacks from the past 10 NFL drafts. The APG for PSR quarterbacks and all quarterbacks is indicated with dotted lines.

Figure 3 The APG of 12 R10 quarterbacks from the past 10 NFL drafts. The APG for R10 quarterbacks and all quarterbacks is indicated with dotted lines.
A likely explanation for such a phenomenon is in the circumstances that cause rookies to fall into each of these categories. Rookie quarterbacks that are drafted with the expectation of instantly bringing success, often those that are picked very early in the draft, typically will be in the PSR category. These players are generally highly talented but given no opportunity to learn without the pressure of the starting job, which tends to decrease performance. However, a slow start can be overcome by these players’ talent later in their careers, as evidenced by the high APG of players multiple years into their careers (Kyler Murray: 0.8769, Joe Burrow: 0.8462, Justin Herbert: 0.8387, Dak Prescott: 0.7982). Thus, while the overall APG is around average, the raw talent of quarterbacks in this category has fueled their success despite unfavorable circumstances.
The R10 category is the worst-performing group, with an APG significantly below average. Quarterbacks that fall into this category are often drafted later than PSR quarterbacks but still do not receive much opportunity to learn before starting. Many R10 quarterbacks were rookies forced into the starting role due to an underperforming team or injury, despite their potential unpreparedness. For example, a rookie drafted to be a PBR could become an R10 due to a season-ending injury to the primary starter, losing the benefits from a year of learning. Because of this, their performance is much worse overall, as seen in the below-average APG. However, three R10 quarterbacks (Josh Allen: 0.8830, Justin Fields: 0.8500, Tua Tagovailoa: 0.7170) indicate that success is still possible, albeit at a lower proportion.
Finally, the PBR quarterbacks experience the greatest career success, as expected. This is largely buoyed by the top four PBR quarterbacks skewing the APG (Mahomes, Jackson, Purdy, Hurts), but it nonetheless shows the benefit of the learning experience as a rookie backup. Additionally, PBR quarterbacks often are drafted into highly favorable circumstances, with all four top quarterbacks in very successful systems. This is another factor that can contribute strongly to the career success of a quarterback. While success is far from guaranteed, with half (6/12) still performing with an APG below average, the overall production from this group makes it the most successful of the three.
Wide Receivers
Projecting NFL wide receiver success proved to be more difficult than quarterbacks, as college football does not record advanced stats such as separation or contested catch metrics. Using the available data, we wanted to predict how the top 20 wide receiver prospects would perform in the NFL. All of the top 20 WR prospects are very likely to be drafted within the first three rounds of the draft, so for our testing, we looked at every active NFL receiver drafted in the first three rounds. To quantify success, we used weighted career approximate value (wAV). This was then divided by total games played (wAV/G) to provide a consistent statistic among receivers who have played different amounts of games. We also looked at the receiver’s wAV/G as a rookie to predict the receiver’s success in their rookie year as well as their career. For reference, the highest wAV/G was 0.77 and the lowest was 0.0625.
First, we performed a linear regression between the physical attributes of WRs (40-yard dash time, height, and weight) and NFL success. There were minimal correlations between both wAV/G and Rookie wAVG and the physical attributes. This result makes sense as NFL receivers have succeeded at various heights and speeds.
Next, we looked at college production of NFL WRs. To quantify college production into a single number, we used the Dominator rating for the receiver’s last year played in college. In short, the Dominator rating is the average of the proportion of a receiver’s yards over a team’s total receiving yards and the proportion of a receiver’s touchdowns over a team’s total receiving touchdowns. To compare college production to NFL success, we performed a linear regression between Dominator rating and wAV/G. In this model, we see that the P >|t| is 0.0516, which is near the statistically significant level.

We also performed a linear regression between the Dominator rating and Rookie wAV/G. In this model the P >|t| is 0.0366, which means that the Dominator rating is a statistically significant predictor of Rookie wAV/G.

The P >|t| value for Rookie wAV/G shows that Dominator Rating can be used as a predictor for NFL success. Using the regression models to predict NFL success for the top 20 WR prospects in the 2024 draft yields this result:

As expected, Marvin Harrison Jr. is at the top of the list. Notable risers in this model are Roman Wilson (Michigan), Xavier Legette, and Jermaine Burton, who are number 2, 3, and 4 respectively. Also, it should be noted that projected 1st rounders Rome Odunze, Brian Thomas, and Troy Franklin are ranked lower.
Ultimately, this model needs to be interpreted with caution. While the dominator rating is useful, it does not take into account the strength of the schedule, so a 200-yard game against an FCS school is rewarded the same as a 200-yard game against a conference opponent. The dominator rating also does not factor in teammates’ performance. For example, all 3 of Washington’s receivers (Odunze, McMillan, and Polk) have lower dominator ratings because they all racked up large receiving numbers for the same team. Although the model may not perfectly predict WR success in the NFL, knowing that dominator rating can be used to evaluate WR prospects is valuable.
Summary
The overall goal of this analysis was to predict the most successful quarterbacks and receivers for the upcoming 2024 NFL draft. Through the development of different regression models, we found certain metrics that, when used together, can predict NFL success fairly accurately. Generally, each quarterback brings a different skill set to the table, and modeling can show which traits stand out so that teams can hit on their draft picks more often. Due to the nature of categorizing quarterbacks as PSR, R10, and PBR, the draft circumstance is a better generalization that may not be as useful for individuals, especially when considering the most recent outlier in C.J. Stroud. However, according to the current 2024 draft order, the Giants (No. 6), Falcons (No. 8), Jets (No. 10), Vikings (No. 11), and Broncos (No. 12) selections are the likeliest for a PBR quarterback. Combining these two analyses, the two quarterbacks with the highest likelihood of NFL career success are Bo Nix and Jayden Daniels.
Data Collection: https://docs.google.com/spreadsheets/d/1-vgc1QwWj2L266PnOAzdPAkAN8y_lKNmh8pzMbtleO4/edit?usp=sharing
Be the first to comment on "Using Machine Learning and College Profiles to Predict NFL Success"