
Author: Nathan Andriessen (nathanandriessen2023@u.northwestern.edu),Weinberg, 2023
With the 2020-2021 NBA season just around the corner, narratives begin to form around basketball media: LeBron James chasing his 4th ring to bolster his case for the basketball GOAT, Stephen Curry coming back at full strength with a vengeance, or Giannis Antetokounmpo trying once again to prove that his stats are not empty. Focusing on the last point, what exactly does it mean to have empty stats? To take it one step further, what do statistics in basketball really mean?
Baseball has wholeheartedly adopted statistical analysis into the pros, and basketball seems to be the next major sport to fully integrate statistical analysis. We already begin to see this in media. Indicators like effective field goal percentage, plus/minus, player efficiency rating are being used to compare players to each other. With that, let us delve into what these statistics really mean about a player’s on court performance.
A glossary will be included at the end to reference all abbreviations used in this article.
Effective Field Goal Percentage (eFG%)
This is a stat that takes into account the fact that three-pointers are worth more than twos. Per basketball reference, the formula is:
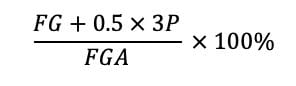
An example of how this plays out with actual numbers would go like this. Player A is 4/10 from the field, going 2/2 from three. Player B is 5/10 from the field, 0/0 from three. Both players have 10 points in the game, but player A’s FG% is 40%, while player B’s is 50%. At an initial glance, player B was more efficient this game. However, using eFG%, taking into account player A’s two threes, both players sit at a 50% eFG%. But what about a player like James Harden? He misses many shots, so his eFG% would be low, but also takes a league-leading number of free throws that also count towards his point total. To factor those in, we can use a more advanced shooting metric:
True Shooting Percentage (TS%)
True Shooting takes into account all ways a player can score points in basketball: field goals, three pointers, and free throws. Per basketball reference, the formula for TS% is:

This is a slightly more advanced metric that tries to better capture how efficiently a player can score points in a basketball game. However, like eFG%, this statistic is not perfect either. The 0.44 in the denominator is a weighted average of how a player gets his free throws: 2 point shooting fouls, 3 point shooting fouls, and-1s, or technical fouls. In the modern era, this is not a problem, as shooting tendencies within the same era tend to stay similar. But if TS% was used to compare, say, Kareem Abdul-Jabbar and Giannis, problems would arise from that 0.44 denominator. Threes only became a thing in the NBA halfway through Kareem’s career, disrupting the balance of the coefficient. Hopefully, this shows how even statistics are not perfect, but anything is better than just looking at FG%. Moving on to a different type of metric:
On-court/Off-court Plus/Minus
These are two very simple metrics that are related to each other. On-court Plus/Minus is the point differential between the two teams while a given player is on the court. Off-Court Plus/Minus is the point differential between the two teams while a given player is off the court. Because of its simplicity, there are many flaws to using this as the only reference for how good a player is. A player’s Plus/Minus is influenced by how well his teammates are playing. If a teammate suddenly shoots very well while player A is on the court, naturally, player A’s Plus/Minus will rise, but it was not player A’s contributions that made it go up. For an example, let us look at Eric Bledsoe and Devin Booker. For the 2019-2020 season, Eric Bledsoe’s On-court Plus/Minus was +11.8 per 100 possessions (this is to standardize statistics to account for different playing times), while Devin Booker’s was +2.1 per 100 possessions. Bledsoe’s Plus/Minus was nearly 6 times as high as Booker’s, but most basketball fans would say that Booker is the better player by far, especially given his performance in the bubble earlier this year. Bledsoe’s plus minus was likely carried by his All-Star teammates, and a winning team. Booker’s was dragged down by being the only real star on his team, and a losing team.
Other factors like team chemistry, how well a player fits the system are all factors that influence the final plus/minus but are not factored into the calculation. For a slightly better metric that factors in plus/minus, use:
Real Plus/Minus (RPM)
Real plus minus is a rather unique statistic. All of the statistics discussed thus far have been descriptive statistics. They encapsulate how a player has performed so far in the season. RPM is a predictive statistic. In its calculations, player performance from past seasons is factored in, hence the predictive nature of RPM. It is useful when differentiating between a player who has been consistently good throughout his career, and a historically bad player who is having a good season. As is a recurring theme in this article thus far, this statistic has its fair share of flaws. RPM tends to not be good when used on a player whose improvements/regressions are greater than what is to be expected of a player that age. For example, Anthony Davis came into the league an already great player, but rose to elite status a year or two after entering the league. RPM tends to predict the performance of players like Anthony Davis poorly. His 7th ranked RPM in 2019-2020, below the likes of Christian Wood and Jayson Tatum, shows just that.To end off this article, an all-encompassing statistic:
Player Efficiency Rating (PER)
The gospel of modern basketball analytics. PER tries to take into account every possible facet of a player’s game, both positive and negative, then put it through a series of complex calculations that weigh the value of possible actions a player could take to return an estimate of how good a player is on a per-minute basis. In general, it is probably the best metric to measure a player’s offensive output, but lacks in measuring a player’s defensive impact; it only factors in blocks and steals as ‘defensive’ statistics. So defensive specialists like Robert Covington (13.3 PER in 2019-2020, 128th in the league) or Mike Conley (14.1 PER in 2019-2020, 116th in the league) tend to have low PER, while offensive specialists like Karl Anthony-Towns (26.5 PER in 2019-2020, 7th in the league) or Trae Young (23.9 PER in 2019-2020, 12th in the league) tend to lead the league.
While most would agree that Karl Anthony-Towns is a better player than Mike Conley, he’s probably not nearly twice as good as Conley. Intangibles like leadership and experience simply cannot be included in statistical analysis, so these numbers should always be taken with a grain of salt.
This article was the quick and dirty rundown of some common statistics commonly used in the NBA now. There is much more to these statistics than what I have written, and I encourage the readers to study more about these statistics and get a better understanding of what they truly reflect. Beyond that, there are other individual statistics that I did not discuss in this article like Win Shares, Offensive/Defensive rating, and others. These statistics, when used together, provide an invaluable image of what a player truly does on the court. But when used independently of each other, may cause one to arrive at dangerously wrong conclusions about a player.
All statistics and formulas sourced from basketball-reference.com
Glossary
FG = Field Goals Made
3P = 3 Pointers Made
FGA = Field Goal Attempts
PTS = Points Scored
FTA = Free Throw Attempts
Be the first to comment on "An Introduction to Advanced Basketball Statistics: Individual Statistics"