Author: Bannasorn Paspanthong (bannasornpaspanthong2023@u.northwestern.edu), McCormick
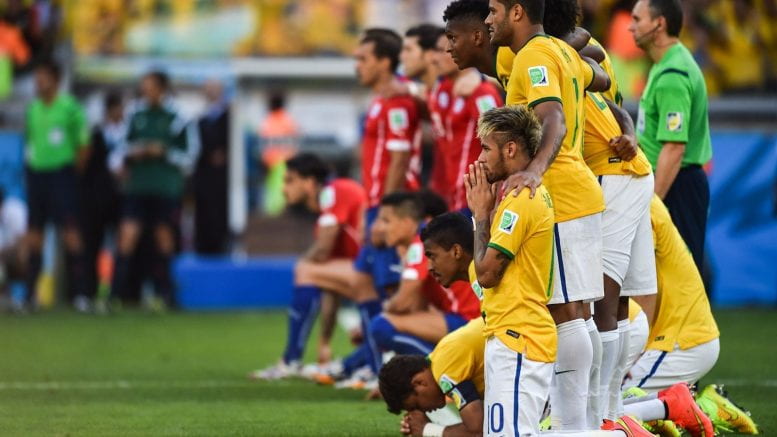
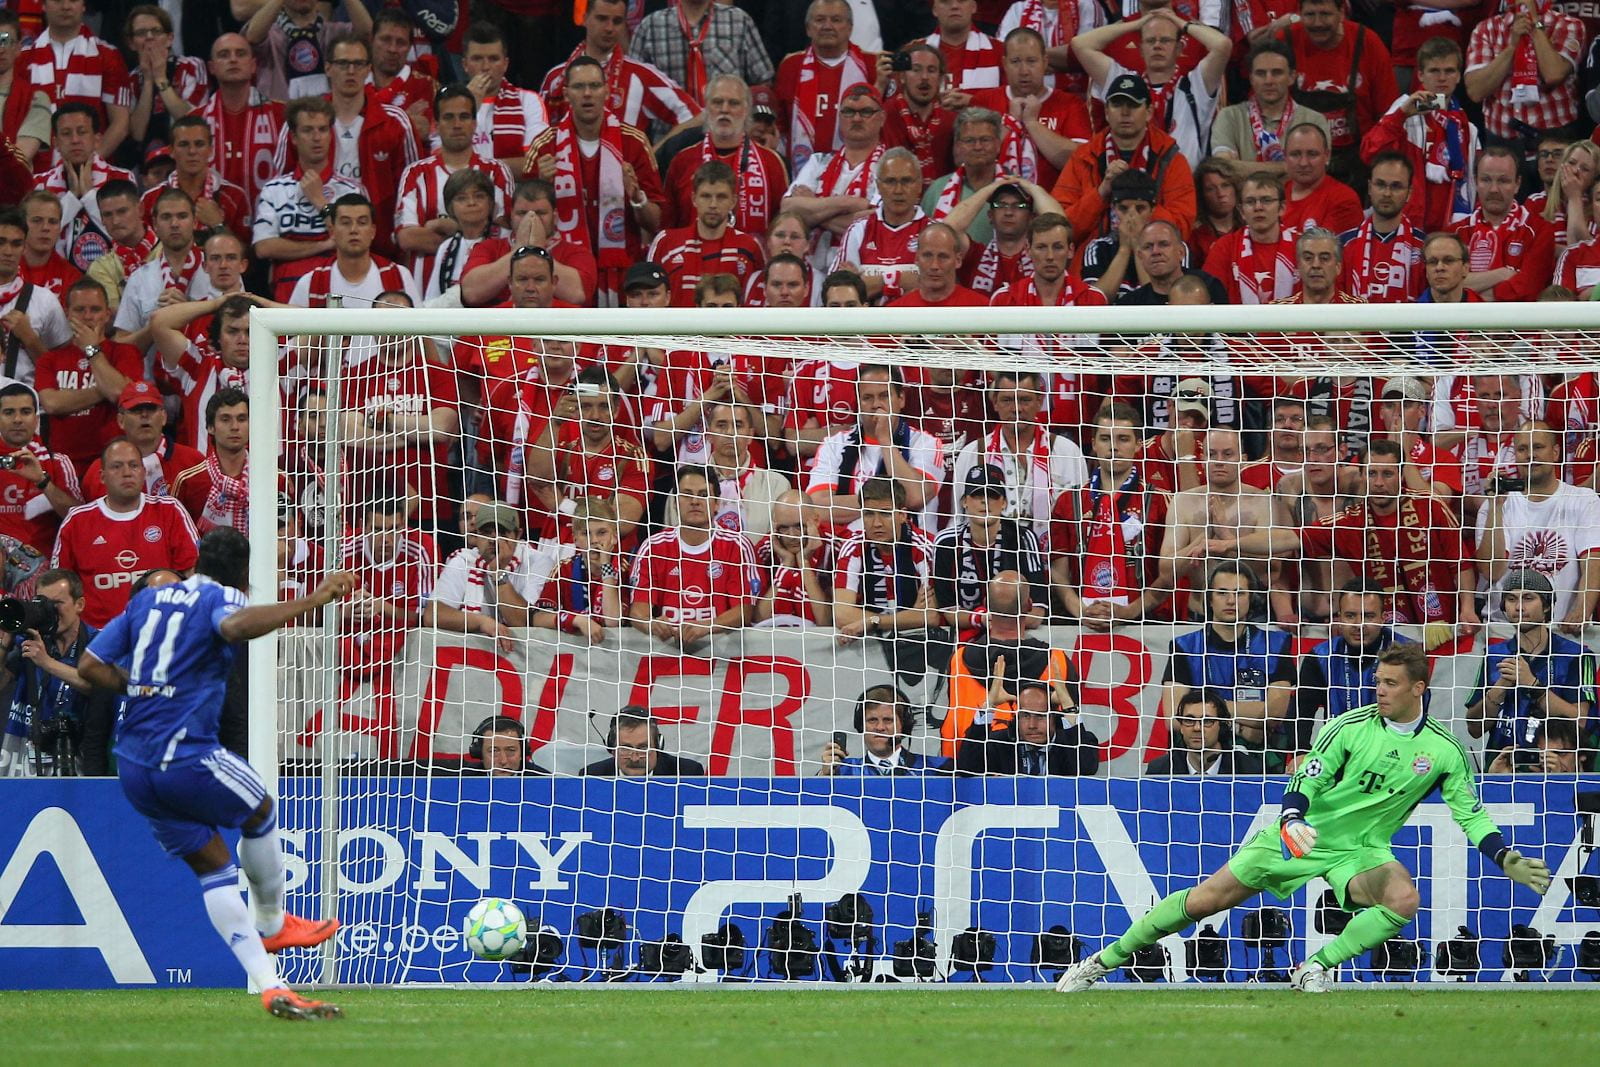
There is a saying that, in soccer, a penalty shootout cannot be practiced at the training ground because it can only be practiced in the real stadium in front of tens of thousands of fans. A penalty shootout is undeniably the most intense component of many soccer competitions ranging from the national levels, such as FA Cup or Copa de la Liga, to world bests like UEFA Champions League and World Cup. Imagine the world’s best two teams end the World Cup final with a 1-1 draw after 90 minutes and extra time; everything comes down to a penalty shootout that will determine the champion. Split seconds will create a heroic moment for one player and permanent scars in some players’ hearts.
In this special moment of soccer, there are lots of statistical data about players’ behavior that we can investigate. In this particular case, we will investigate players’ behavior during World Cup 1982 to 2018. Most of the visualization will be a heatmap that compares to the regions in the goal divided as seen in figure 2. (Every visualization is provided with shooters’ point of view)
During World Cup 1982 to 2018, the conversion rate is surprisingly low at around 70% compared to a normal penalty conversion rate, from all competitions, at around 80 – 85%. We shall see the penalty takers’ favorite zone of the goal to aim to. As we can see in figure 3, we can see a clear trend. Comparing the left and right sides of the goal, players prefer to aim for the left side of the goal. The most intuitive reason is that most players are right-footed and it’s easier for them (not for the author) to aim for the left side like this example from Cristiano Ronaldo. Moreover, the players have a stronger preference to aim for the bottom of the goal in which it is easier for them to control the ball to be on target. Thus, we see that the favorite spots of the players are bottom left with 22.58% and bottom right with 16.49% of the time. As we can see that most players do not choose to aim for the middle area (around 6 – 7% in each zone) because it is theoretically the easiest for the goalkeeper to save. However, in some rare events, some players use reverse psychology and aim for the middle. Some even go further and try a piece of art called ‘Panenka Penalty’.
When we investigate the chance of scoring in each zone (see figure 4), we see two trends. First, aiming to the right side of the goal has higher success rates. The reason could be that most goalkeepers are right-footed, which makes it easier to dive to the left side of the goal (see figure 5 for numerical values). Second, aiming to the top of the goal has higher success rates as well. With the same reasoning, we believe that it’s easier for the goalkeepers to dive to zones 7 and 9 compared to the top parts (need to jump against the gravity). One interesting point is that the top-right corner (zone 3) has the highest success rate with 87.5%, but it’s the lowest on the list for the players’ favorite zone (in figure 3) with 5.73%. We can say that the top-right corner is the “high-risk high-reward” zone for the penalty shootout.
How about the worst-case scenario? One of the scariest scenes for the penalty takers is to see the goalkeeper dive in the same direction as the ball. If the goalkeepers dive the right way, it all comes down to the quality of your shot. Bad shots can be easily saved by the goalkeeper. Using conditional probability, we can see a decrease in the percentage of scoring (8 out of 9 zones) when goalkeepers dive the right way in figure 5. Despite the calculation with conditional probability, we still see the same trend that aiming high and to the right has a generally higher success rate.
As we know that a penalty shootout is intense. There are some “decision shots/saves” that will decide the outcome of the game. With a higher pressure parameter, the probability of scoring a decisive penalty drops slightly to 66.67%. Comparing figures 3 and 7, we can see that there are two types of players: those who choose the safety option and those who choose zone 3 to maximize the probability of scoring. We can see that the percentages of most zones drop while bottom-left and top-right percentages go up to 25% from 22.58% and to 11.11% from 5.73% respectively. In terms of the goalkeepers, we can see some changes in the proportion of zones in figure 8; however, we cannot conclude that the behavior of the goalkeepers have changed because the changes are relatively small. (Disclaimer: the data for decisive events is summarized from a small sample size, the data might be misleading due to the margin of error)
In conclusion, players tend to aim for the bottom corners, zone 4, and 6 most of the time with a total percentage of 63.8%. This suggests that the goalkeepers should dive and aim to save shots in zone 4 and 5 or zone 6 and 9 to maximize the saving rate (can also increase the chance even higher by watching the body positions or studying shooters’ favorite zone in advance). For the player, it is beneficial to practice to be comfortable with aiming at zone 1 and 3 in case the team wants a definite goal. And lastly, don’t forget to enjoy the most intense moment of the beautiful game!
Data: https://www.kaggle.com/pablollanderos33/world-cup-penalty-shootouts


Be the first to comment on "The Numbers behind Penalty Shootout in World Cup"