|by Aditya “Adi” Tyagi and Aditya Gudal|
1. Introduction

When you first considered going to graduate school or undergraduate school, you were no doubt quickly made aware of the ranking of the school. Every school is competing to be ranked higher in all ranking systems (QS world rankings, Times Higher Education and U.S. News) by marketing and advertising courses, student recruitment and diversity, faculty engagement. In fact, the above screenshot (from our very own MSiA program website), demonstrates how prominently academic programs advertise their rankings in order to shape student perceptions. Indeed, rankings have become an indelible part of the modern educational landscape.
The list of rankings can become increasingly diverse. Each ranking may prioritize different measures of excellence, and this in turn, may produce different ‘top schools’. For example, here is a sampling of some of the rankings produced by US News & World Report:
- Top National Universities
- Top Global Universities
- Top A+ Schools for B Students
- Top Schools with the best “First Year Experiences”
- Top Schools with the best Co-ops/Internships
- Top schools with the best Study Abroad
- Top Schools with the most Fraternity/Sorority Members
- Top Schools with the most International Students
As you can see, each ranking emphasizes a different aspect of a students’ higher education experience. A major benefit is that students are free to pick a university, based on what aspect they find most valuable. However, the diversity of rankings available also has consequences for universities. For example, each university must decide exactly which institutional aspects to prioritize based on its educational mission. This is a decision problem that is amenable to data analytics.
2. Motivation
Since each ranking has its own methodology, it is often unclear, from an institutional perspective, which aspects one should focus on to maximize impact. For example, some metrics emphasize a university’s relationship with industry; others value an international outlook, and yet others prioritize research output. The result is a broad range of metrics with plenty of tradeoffs that each university must navigate. For example, most universities face problems in improving their international outlook, as they stress more on domestic research, which is generally due to territorial competition within different countries.
At Northwestern, the Office of Institutional Research (OIR) has approached the MSiA program to analyze rankings and various systems and explore discrepancy. Over the Winter Quarter of 2020 we collaborated with OIR to work on one of these discrepancies as a case study problem that Northwestern faces. We examined three prominent rankings, commonly referred to as the “Big Three Rankings”: The Times Higher Ed (THE) , the QS World Rankings, and US News & World Report (USNWR). Some would also include the Academic Ranking of World Universities (ARWU), which we did not analyze in this study. The main goal of this project was to explore ways to improve ranking outcomes, with a focus on the Times Higher Ed Rankings.
3. Approach Overview
To understand the core of the potential problems and discrepancy with various ranking systems, we categorized the contributing factors into two types: endogenous and exogenous. Exogenous factors are inherent to the ranking system itself, while endogenous factors can be controlled by the institutions, such as Northwestern University. We placed a particular emphasis on Northwestern’s international profile as we analyzed with the assumption that it could be a potential root cause problem in the ranking position of the university. The following two research questions guided this study:
- Do elite schools on the Times Higher Ed Ranking benefit from higher international collaboration rates?
- What effect (if any) does THE’s European origins have on the ranking outcome?
Having established the root cause of the ranking outcome, we aimed to provide recommendations to improve Northwestern’s ranking, with respect to endogenous factors.
During our nine month long study, we analyzed the datasets from the following sources:
- Internal client provided data (THE DataPoints): THE DataPoints is a data product provided by THE to institutions that suggests areas of improvement and other analytics.
- Elsevier’s SCOPUS: Elsevier’s SCOPUS is a bibliometric service that has created SCOPUS. SCOPUS is a data product that allows researchers to get a sense of bibliography information regarding their school (co-authorship rates, university collaboration on academic research, etc.).
4. Literature Review
A) General Overview
According to Bookstein et al. (2010), THE Rankings are unstable. For example, 95% of schools remain in the top 200, but experience drastic position change from year to year. The bottom two third of schools experience twice more changes in their positions than the top one third. Some of the reasons behind this instability are:
- Power Law Distributions: Key components of the THE, such as peer review, employer review, citations per faculty originate in power law distributions. Power law distributions can be used to describe phenomena, where a small number of items is clustered at the top of a distribution (or at the bottom), taking up 95% of the resources. In other words, it implies a small amount of occurrences is common, while larger occurrences are rare. A classic example is the distribution of income. Mathematically, one may express a power law by Y = kXa , where k and a are constants determining the distribution.
- Definition Changes: THE Ranking changes its definitions of how variables are measured over time. For example, when THE decided to measure student:staff ratio differently, the University of Copenhagen student to staff ratio went from 51 to 100. This gave the University of Copenhagen a 43 rank gain in a single year! It is unrealistic to think that the University of Copenhagen’s student to staff ratio actually changed so drastically in a single year; the ranking gain is most likely due to THE definition changes.
- Sample Survey Changes: THE Rankings also include a peer review component. This peer review sample changes from year to year. For example, peer review sample size changed from 6534 in 2008 to 9836 in 2009.
The above-mentioned problems imply that there are certain random and exogenous factors in Northwestern’s ranking which is beyond the university’s control. In addition, the THE rankings are unstable and an institution’s instability depends on its current position in the ranking. For example, the higher up a given institution is on the THE ranking, the lower the instability.
Dobrota et al. (2016) investigated the ways to stabilize the QS World University Ranking system using the composite I-Distance Indicator method. A key implication of this method is that it can be used to generate new weights for the THE ranking system to make the ranking more stable to year to year fluctuations. This method allows researchers to evaluate a certain university’s ranking position independently of the entire system’s instability.
According to Bornmann & F. Aneg’on (2013), evaluating and quantifying research outcomes are crucial for universities. Citation impact, research reputation, and international outlook are particularly important. The authors proposed a key metric to quantify research impact using percentile of papers cited by others as an excellence rate in research output. This metric is applied to a single paper, and is defined as “the percentile rank of a paper when ordered in descending order of citations”. The authors suggested compiling the reference set is to “include all papers published in the same field in the same year”. A natural way to compare institutions’ research impact is to then compare the respective excellence rates. Bornmann & Aneg´on analyzed the following two databases in their study:
- SCImago (https://www.scimagojr.com/): provides information, such as number of publications, excellence rate, proportion of international collaboration.
- Leiden Rankings (https://www.leidenranking.com/) : provides key metrics on the number of publications, mean citation score, mean normalized citation score, and excellence rate.
Daraio & Bonaccorsi (2017) provide a novel perspective on indicators based on their variability over the years. In the current system, most indicators are based on Content, Aggregation, Methodology and Implications. The authors concluded that resources available to each university vary based on geography, government funding and initiatives and the granularity varies from territorial, institutional and disciplinary. Based on the European universities case, they introduced a new evaluation approach with an articulated ontology-based data integration model. This novel approach permits the construction of new indicators.
B) Case Study Overview: Case Western
Bernal (2017) determined three sources that were holding Case Western University’s ranking down. These were Institution Name Variations (e.g. Univ. of Northwestern vs. Northwestern University), Faculty Affiliation and Variation (E.g. J. Doe vs. Jon Doe vs. John Doe), and Faculty Impact.
Bernal used a bibliometrics approach to improve the ranking of the university. Bibliometrics is the use of statistical methods to analyze books, articles and other publications. This scientific approach uses both quantitative and qualitative indicators (peer review, funding received, the number of patents, awards granted etc.,) to assess the quality and impact of research. Based on bibliometric analysis, Bernal increased the number of publications from 89,000 to 110,000 in the following year. The author managed to improve the ranking of the university by identifying and fixing the core problem with variations in author name (e.g J. Doe vs. Doe, John) and variations in affiliation name (e.g. Northwestern University vs. NW Univ.; Univ. of Calif., Berkeley vs. Berkeley University; etc.) These two issues were successfully resolved by exhaustively enumerating author name variations for Case Western’s most productive faculty, and ‘claiming/attributing’ research output correctly on SCOPUS. Often, researchers’ work was mis-attributed by SCOPUS based on visiting appointments, etc. Finally, Bernal also integrated ORCID ID’s for each of their faculty members. ORCID ID’s are unique identifiers of a faculty that stays with him/her permanently even when they switch jobs at different institutions. This ID is important to keep publications correctly attributed to the respective institutions.
As a result of her initiative, Bernal managed to improve her university’s outcomes on the following rankings:
- QS World University Rankings: 213 to 186 (↑ 27 positions)
- THE World Rankings: 158 to 132 (↑ 26 positions)
- CWTS Leiden Rankings: 143 to 57 (↑ 86 positions)
The CWTS (Center for Science & Technology Studies (Dutch) gain is particularly important because it is constructed solely on the bibliometric impact of a University. Bernal’s study illustrates the massive impact that correct bibliometric attribution could have on a university’s ranking.
5. Methodology
(A) Data Collection
As a reminder our two research questions are:
- Do elite schools on the Times Higher Education (THE) Ranking benefit from higher international collaboration rates?
- What effect (if any) does THE’s European origins have on the ranking outcome?
We distilled the above two questions into formal statistical hypotheses (explained further below). To formalize our approach, we developed a four step strategy to ensure consistency and integrity of data collection:
- Data Collection Plan
- Data Acquisition
- Collaboration Classification
- Data collection
Each of the above steps is explained in detail in the below sections.
(i) Data collection Plan:
We divided the schools into two roughly equally sized groups:
- ELITES: Oxford, Caltech, Cambridge, Stanford, MIT, Princeton, Harvard, Yale, University of Chicago, Imperial College, University of Pennsylvania, Johns Hopkins, UC Berkeley
- PEERS: Northwestern, Brown, Columbia, Cornell, Duke, ETH Zurich, EPFL, McGill, New York University (NYU), Notre Dame, Rice, USC, UCL, Vanderbilt, Washington University in St Louis.
Rationale: Schools near the top of the THE Rankings were assigned to the ELITES group, while schools in the neighborhood of Northwestern (above and below) were assigned to the PEERS group. The PEERs group was also supplemented by schools suggested by the client. There were 16 peer schools and 13 elite schools.
Each researcher was assigned a group and then collected data exclusively from that group.
(ii) Data Acquisition
The key data acquisition step consisted of:
- Visiting an institution’s collaborating affiliation page on SCOPUS [https://www.scopus.com/search/form.uri?display=basic]
- Recording the number of documents the target institution “co-authored” with other institutions.
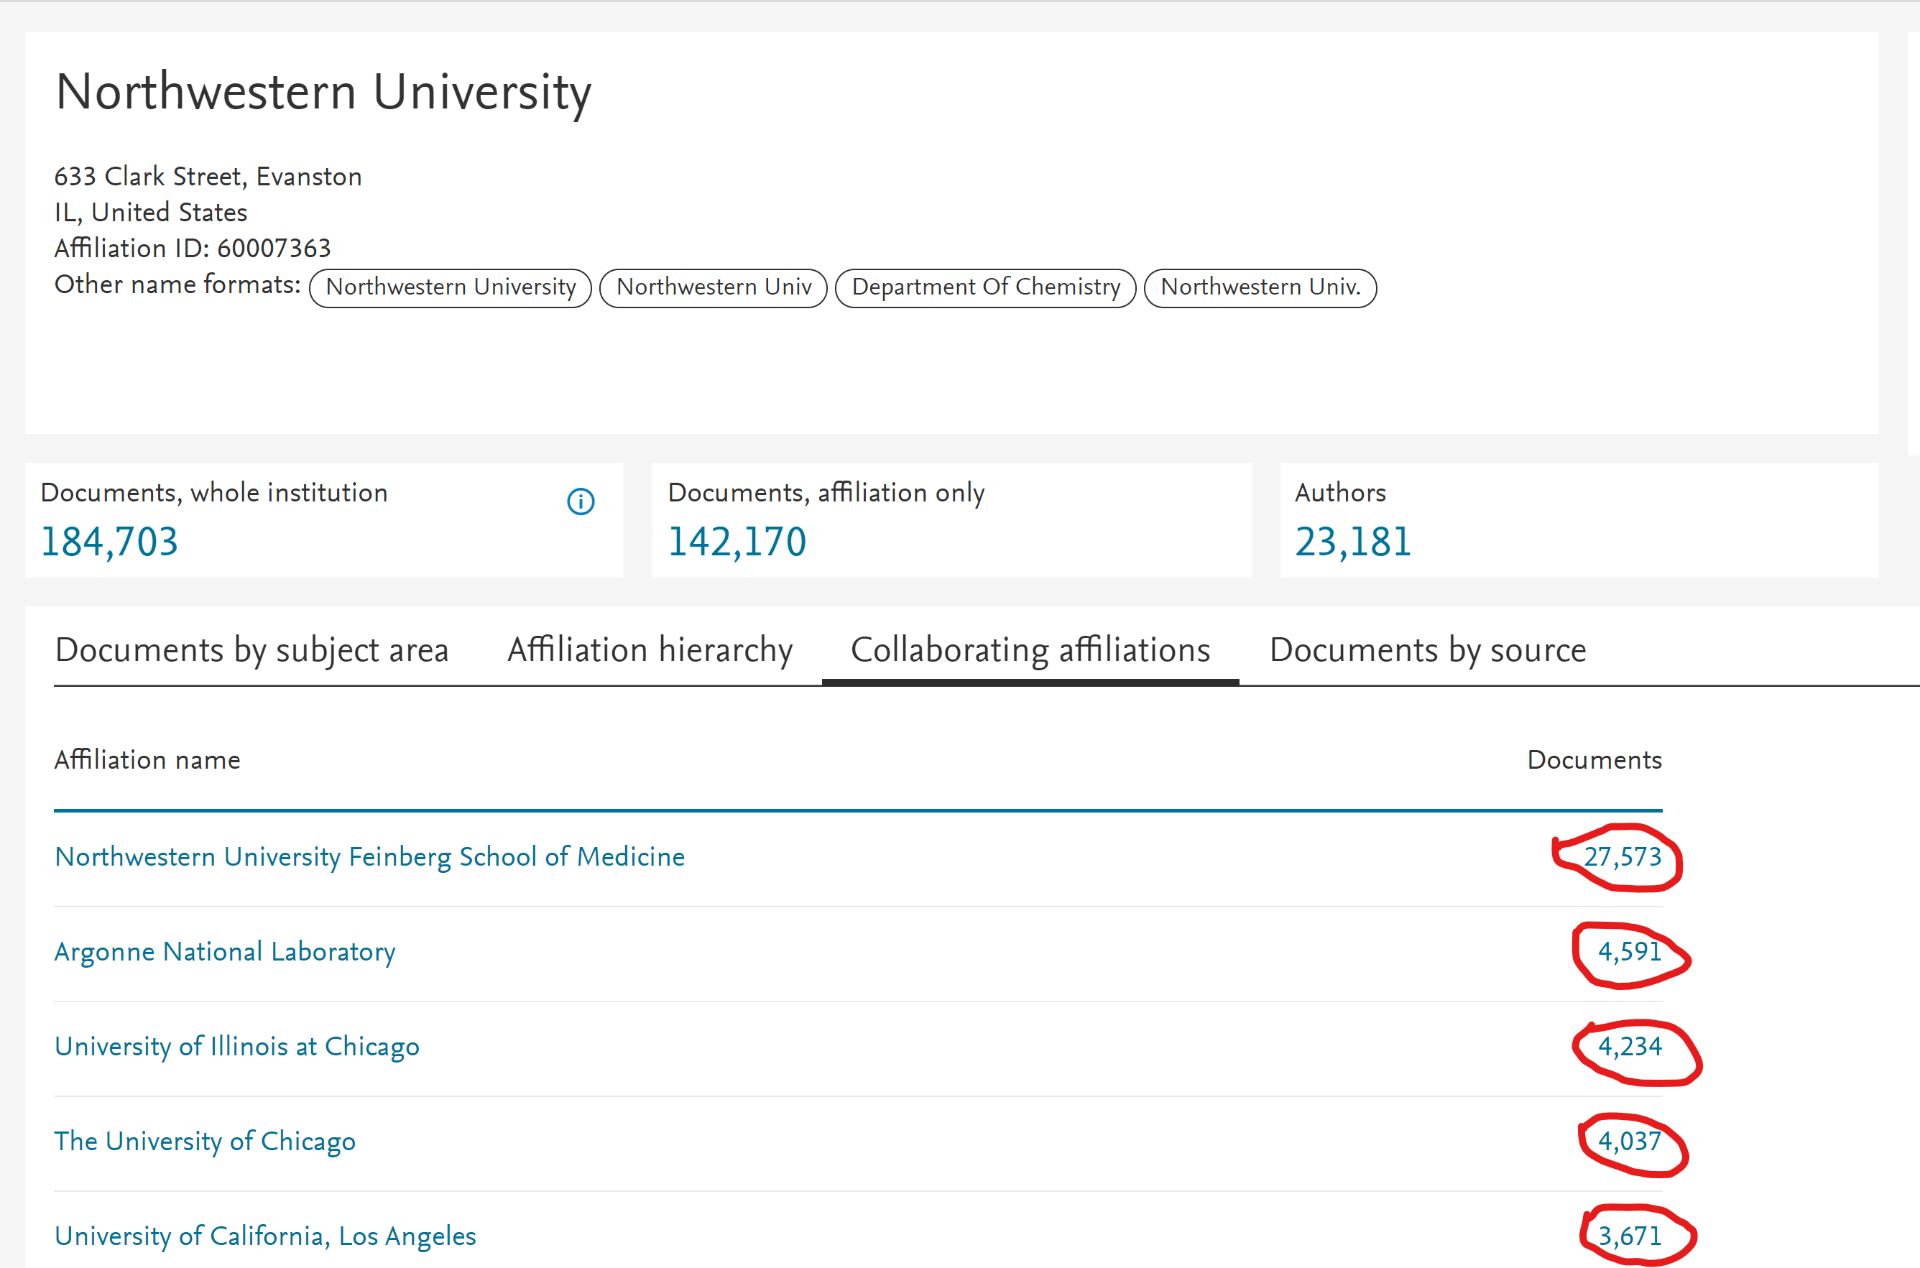
Figure 1 illustrates the data acquisition for Northwestern as an example. Each circled number indicates the number of documents that were co-authored by scholar/s of Northwestern University and various other institutions, such as University of Illinois at Chicago. Something important to notice is that the collaborations are by affiliation, so Northwestern University and Northwestern Feinberg School of Medicine can ‘collaborate’ even though Feinberg falls ‘under’ Northwestern. A helpful way to think of affiliation is as the name of the organization that is written under a researcher’s name on an academic paper. A sample of data collection is presented in Figure 2.

(iii) Collaboration Classification
The next step consisted of classifying each collaboration as international or domestic. Since there were about 200 collaborations per institution and 10 institutions assigned for each researcher, classifying them solely by hand would have been tedious and inefficient. To speed up this work, we developed a classification algorithm to identify where an institution was from, and classify whether a given collaboration was domestic or international.
The algorithm relied on a database which mapped a university’s name to the country where it was located. The key idea was to lookup entries in the lookup database, and then return the university’s country. However, in this process we faced a major challenge with too many spelling variations/mistakes for a given university in the data downloaded from SCOPUS. Our algorithm is managed to solve that problem. We were able to automatically classify between 40%-60% of entries in the collaboration table we scraped. The remaining data was classified by hand. The end outcome was that dataset creation times were roughly halved. It is inspired by the famous MS Excel function “Fuzzy Lookup”, which looks up an entry in a lookup based on a “rough match” with a provided search key. A brief sketch of how our algorithm operates is provided below.
Fuzzy Lookup Algorithm
- For a given target university, search in the lookup table for an exact match. If there is an exact match, then return the country;
- If there isn’t an exact match, then compute the Levenshtein distance/similarity metric between the target university and all other universities in the lookup table;
- Select the university in the lookup table with the highest similarity to the target university;
- If the similarity metric is higher than the threshold, then return that university’s country; else return NA.
(iv) Data Collation
Our final step consisted of data collation. This step essentially involved converting the raw collaboration data to proportions of international collaboration for each school. This meant taking multiple tables, such as those depicted in Figure 3 and producing a table for each group (elites, peers):

The key column above is Column D, which is the proportion of internationally co-authored documents by a given university. This is the final dataset that we used to test our hypotheses.
B. Data Points Analysis
We began our analysis by analyzing data from Data Points, which is an application programming interface tool provided by Times Higher Education with metric scores, values, university groups, subject distribution and benchmark statistics of different institutes all around the world. Access to the API of this repository was provided by OIR, Northwestern University. Based on this data we analyzed the institute (Northwestern University) and the institute’s peers (Harvard, MIT, Princeton, Upenn). A descriptive analysis was done using Python and Jupyter Notebooks to get a preliminary idea about how Northwestern’s ranks change with regards to its peers and the Times Higher Education metrics.
We looked at data over five years 2016 – 2020. The data included metric values and scores designated by THE to the institutes, subject distribution (including engineering, social sciences, arts, health, life and physical sciences), benchmark statistics in different subject areas. A few other important metrics were doctorate to bachelor awarded, doctorate awarded to academic staff, teaching reputation, research reputation, institutional income to academic staff, students to academic staff, publications per staff, research income to academic staff, research reputation, citation impact, industry income to academic staff, percentage of international staff, international co-authorship, percentage of international students.
We followed up with exploratory research and data analysis and constructed box plots, line and scatter plots and descriptive statistics to understand where Northwestern stands with regards to its peers. Our insights are presented in the findings and insights section.
C. Hypothesis Testing
We began hypothesis testing by condensing our questions into two core sub-research questions:
- Representation: How does Elsevier represent Northwestern to THE? Does it share authorship data on an institution basis (i.e. entire University, and all affiliation levels underneath) or an affiliation basis (i.e. affiliation must be explicitly Northwestern University as opposed to say, Feinberg School of Medicine)?
- International Collaboration: Why is Northwestern ranked low on the International scores section of the THE? (it has a score of 64.1)
The answer to the first question (representation) was easily found through qualitative analysis (i.e. no statistical hypothesis testing) of the descriptive writing of THE’s ranking methodology. Elsevier shares data with THE at an institutional level. So, regardless of an author’s individual school affiliation (McCormick School of Engineering, Bienen School Music, Feinberg School of Medicine, etc.), all his/her publications are attributed to Northwestern by Elsevier. We reached this conclusion based on our analysis of Elsevier’s SCOPUS description.
To answer the second research question (international collaboration), we run statistical hypothesis testing. This approach required collecting data, and then running various statistical tests to reject the null hypothesis.
We developed and tested the following two hypotheses:
- ELITES HYPOTHESIS: Elite schools (i.e. those ranked highly on the THE rankings) have higher rates of international collaboration than Northwestern University’s Peer Schools.
- ORIGINS HYPOTHESIS: THE Rankings are European in origin, and thus are designed to favor European schools. (top three global schools are Oxford, Caltech, Cambridge).
In coming up with the Elites Hypothesis, our rationale was that authors worldwide are incentivized to co-author with researchers at Elite schools; this results in Elite schools maintaining their higher international rankings in a cyclical fashion. A potential implication of this “preference for elite collaboration” is that when domestic US universities engage in collaboration with the ‘elites’, that does not count as ‘international collaboration’. However, when non-US institutions engage in collaboration with the ‘elites’, that counts as ‘international collaboration’. It also is disadvantageous that most “elite” universities are in the US. Thus, the nature of the modern academic landscape disadvantages US Schools.
The Origins Hypothesis was based on our assumptions that rankings tend to favor the country that produced them. For example, USNWR is American, and lists the top three global schools as Harvard, MIT, Stanford (all three American). Similarly, THE is a British ranking, and lists Oxford University, CalTech, and Cambridge University as its top three universities. However, there are exceptions to this dynamic: QS Rankings (a British ranking), lists the top three world universities as MIT, Stanford, Harvard (all three American). Meanwhile, Shanghai ARWU (a Chinese ranking) lists the top three Universities as Harvard, Stanford, Cambridge (two American, one British). If these assumptions are true, both of our hypotheses imply that NU’s poor ranking outcome on the THE Ranking is simply because it is an American school.
D. Hypothesis Testing Process
Statistical hypothesis testing is used to get a sense of whether research-based observation is due to random chance vs. a true phenomenon in nature. To test our elites hypothesis, we used a z-test for proportions. This test was used because we are testing whether there is a difference in proportions between two groups (elites and NU peers). The exact proportion we are testing is the ‘proportion of documents co-authored internationally. The two tests we conducted are formalized below:
- Test 1 (Z-test of proportions):
Null Hypothesis: There is no difference between international collaboration rates between elite and peer schools.
Alternative Hypothesis: The international collaboration rate of elite schools is (different from/greater than) NU peer schools.
- Test 2 (Z-test of proportions):
Null Hypothesis: There is no difference between European vs. US schools international collaboration rates
Alternative. Hypothesis: The international collaboration rate of European schools is higher than US schools.
Rationale
Our rationale behind using a two-sample unpaired z-tests for proportions:
- Since we are comparing two groups of universities, it makes sense to use a two-sample z-test.
- Moreover, there are not the same number of universities in both groups and this is not a before/after situation, hence the test needs to be unpaired.
- Each paper published in the ELITES/PEERs group is considered as a random Bernoulli trial with success defined as ‘producing an internationally co-authored paper’
- If we assume a Binomial distribution for the proportion of internationally co-authored papers, then the standard deviation of the distribution is known. This precludes the use of a t-test.
Assumptions:
The assumptions for a two-sample unpaired z-test are supported:
- The expected number of successes np > 10 for each of the groups, where n is the number of trials, and p is the probability of success.
- “Publishing a paper” can be reasonably viewed as a Bernoulli random variable. As a reminder, a Bernoulli random variable represents a binary outcome. In our case, this would be the “publish” “no publish” decision.
- Each Bernoulli trial (to publish a paper) can be reasonably considered independent of the others.
6. Findings & Insights
A) Data Points Analysis

We constructed the above heatmap to identify linear relationships amongst the THE metrics. As you can see from Figure 4, there were several metrics that are highly correlated. For example, we observed almost perfect correlation (0.99) between teaching and research reputation.
In addition to this analysis, we found out that the Times Higher Education gives out a long survey to score teaching and research reputation. The survey instrument seems to present numerous flaws and confusing questions. From our conversations with Prof. Grayson, we discovered that many respondents fill up the same institutes for both the teaching and research reputation survey questions. This is one possible explanation for the high correlations observed above.
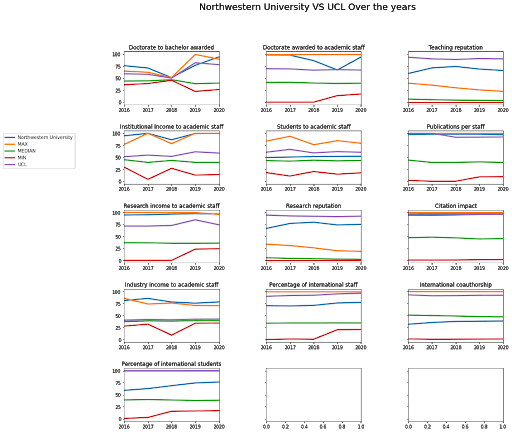
The line plot (Figure 5.) demonstrates that Northwestern University (Blue line) is below the median for the past five years in terms of international co-authorship. Foreign universities, such as University College of London (Purple Line) dominate here. Northwestern University dominates in terms of industry and research income to academic staff, but they need to be more inclusive in getting more international students and staff to stand out in the Times Higher Education ranking which is relative.
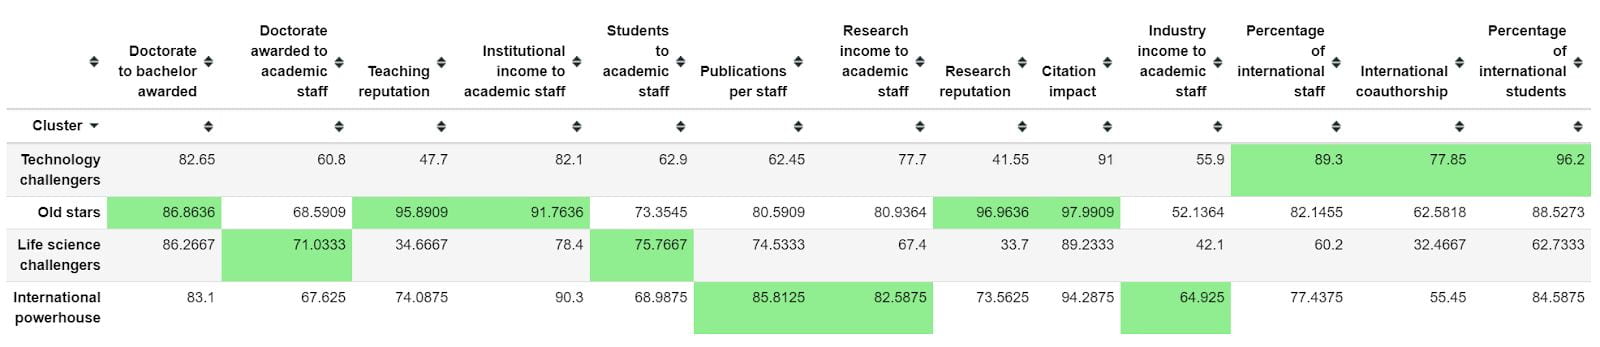
Figure 6 demonstrates which metrics are highest for each of the various groups, namely Technology Challengers, Old Stars and International Powerhouses. These groups were determined by SCOPUS after a clustering analysis on the rankings, and other similarities between institutions. Northwestern University is part of the International powerhouse group.
International powerhouse universities dominate in publications per staff, research income and industry income.
Technology challengers dominate in international staff, students and co-authorship.
All groups have improved significantly in Doctorate to Bachelor awarded over the years and moderately in Institutional income.
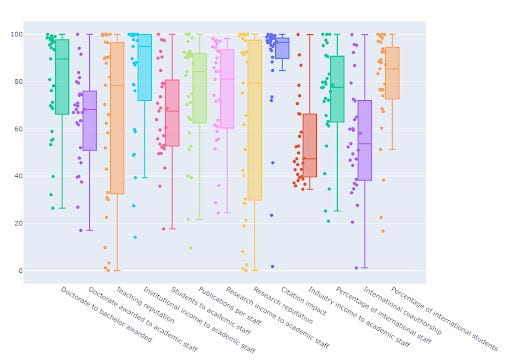
As it is presented In Figure 7, variability in Doctorate to Bachelor awarded scores keeps changing over the years (2016-2020). Citation impact is one metric with small variability or change.
B) Hypothesis Testing
The elites hypothesis stated that elite schools find it easier to attract international collaboration than NU peer schools. In other words, elite schools have higher international collaboration rates than NU peer schools. This results in a “rich-stay-rich” dynamic, where elite schools attract more international collaborators, and thus maintain their elite status, which in turn attracts even more international collaborators.
The Elites Hypothesis was supported (Figure 8).
Null hypothesis: Elite schools and NU Peer Schools have the same rate of international collaboration.
Alternative hypothesis: Elite schools have a higher rate of international collaboration than NU Peer schools.


From the two distributions presented in Figure 8 and Figure 9, it seems that elites have more mass towards the right end of the horizontal axis (i.e. they have higher rates of international collaboration).
Sample Values: p_intl _coll_elites = 0.453 > p_intl_coll_peers = 0.415
Testing Results: P-val: 1e-16
Conclusion: At a significance level << 0.001, we conclude that the alternative is true: elite schools DO have a higher rate of international collaboration than NU Peer schools.
Origins Hypothesis
The origins hypothesis stated that the THE rankings, with its origins in the UK, is designed to favor European schools. In particular, it emphasizes international collaboration, which presumably is easier for European schools to demonstrate. Thus, the hypothesis we test is whether European schools have higher international collaboration rates than North American schools.
Null Hypothesis: European schools have the same international collaboration rate as do North American schools.
Alternative Hypothesis: European schools have a higher rate of international collaboration than American schools.
Sample Values: P_intl_coll_euro = 0.6295 > p_intl_coll_na = 0.4008
Testing Results: P_val = 1e-16
At a significance level << 0.001, we conclude that the alternative is true: European schools DO have a higher rate of international collaboration than North American schools.
7. Summative discussion
A) Data Points Analysis
Given Northwestern’s comparatively poor performance (below median) in terms of international co-authorship for the past five years, it is clear that international co-authorship is an area where improvement needs to happen. Based on our research findings, we suggest:
- Encouraging faculty to attend foreign conferences, and seek out the opportunities for international collaborations.
- Encouraging Northwestern Qatar to collaborate locally in the Middle East. This strategy might improve Northwestern’s international collaboration rate.
- Advertising Northwestern’s programs internationally as well as recruiting foreign staff (perhaps as Visiting Faculty, visiting scholars) to stand out in the Times Higher Education ranking. This approach might require additional funding. However, since Northwestern outperforms its peers in terms of industry and research income to academic staff, these could be the areas where Northwestern could look for potential funding sources.
- Northwestern’s membership in the “international powerhouse” group might be misleading. This is because International powerhouse universities typically dominate in publications per staff, research income and industry income. However, a grouping that may be of interest to Northwestern would be “Technology challengers”. These schools interestingly perform exceedingly well in international staff, students and co-authorship. An analysis of the qualitative characteristics of schools in the Technology Challengers category might yield some useful insights. For example, it may be worthwhile to examine administrative structures, international student recruitment efforts, academic strengths/weaknesses, etc.
B) Hypothesis Testing
Our results from the Elites Hypothesis part indicate that elite schools have higher rates of international collaboration. However, a key limitation to acknowledge is that our analysis does not profess any causal relationship. A famous historical saying in the statistics community is that “Correlation does not equal causation.” This is applicable here. However, we would like to conjecture two reasonable causal relationships:
- It is possible that elite schools (due to their higher status) are able to attract higher collaboration opportunities from international partners.
- These schools are able to maintain their positions at the top because they are able to attract international collaboration.
Thus, it is evident that a “rich get richer/stay rich” dynamic is at work: elite schools maintain their positions at the top by collaborating internationally, and due to their resulting high positions, they are able to attract even more international collaboration. This creates a self-reinforcing dynamic.
Meanwhile, considering the results from the Origins Hypothesis, we can conjecture the following causes. Given the geography of the European Continent (equally well-renowned schools spread out across many small countries) vis a vis North America (well-renowned schools clustered mainly in the US, and to a lesser extent Canada and Mexico), it makes sense that European schools would have higher international collaboration rates. In other words, geography might be the hidden factor determining the ranking discrepancy.
It is interesting to note that this trend was visible in the US-based US News & World Rankings. In its Global 2020 rankings, the top five schools are Harvard, MIT, Stanford, Berkeley, and then Oxford. There are only two non-US schools amongst the Global top 10 according to USNWR Global 2020. As would be expected, international collaboration is factored into the USNWR global rankings, but only relative to country. An offsetting factor is introduced namely, global research reputation, which presumably US-schools dominate. Perhaps, the greatest insight to take from the above hypothesis testing results is how they affect Northwestern.
A valuable visualization to look at is where Northwestern stands relative to its peer group is presented in Figure 10.

It demonstrates that Northwestern lies close to the bottom of its peer group when it comes to international collaboration. This is important because in combination with the other findings, it shows that Northwestern’s low position on the THE rankings is a function of intrinsic and systemic factors. Some of these factors Northwestern can’t control, namely the systemic ones of:
- It is not at Elite school.
- That the THE rankings are European
Yet others it can control, such as: here it stands with respect to its peer group, which it is a fair comparison given the many similar characteristics NU shares with its peers.
8. Conclusion – Recommended Actions & Next Steps
In this paper, we demonstrated that Elite schools do have a higher rate of international collaboration than Northwestern University’s peer schools. This result could be hiding a “rich get richer” dynamic. Moreover, we demonstrated that European schools have higher international collaboration rates than North American schools. This results in European schools being ranked favorably by THE (which is a European ranking). We further conjectured that this is because of the geographical setup of the Continent. Despite the above extrinsic factors contributing to North American schools low international outlook position, there are also a few intrinsic ones: many top North American schools are in the bottom 25% of its peer group when it comes to International collaboration. This conclusion is separately confirmed by the DataPoints Analysis.
Finally, correct author and institution attribution on Elsevier’s SCOPUS is critical to any effort to improve ranking in general, especially in ranking systems that focus more on research output. As demonstrated by Bernal (2017), such efforts can yield tremendous gains. However, any effort to correctly attribute bibliometric information must be owned and directed by the University Library.
Another promising direction is to use the Composite I-Distance Indicator (Dobrota et al., 2016) to determine stabilizing weights for the THE Rankings. Having generated a ‘stabilized ranking’, subsequent analyses would provide greater insight into Northwestern’s position independent of ranking instability. This strategy would give a clearer picture of what actions Northwestern and most of the top North American universities could take to improve its ‘intrinsic position’ on the Times Higher Education.
9. References:
Bernal, L.(2017). Library Impact with International Rankings – One Library’s Continuous Journey to figure it out. Retrieved from: https://www.libraryassessment.org/wp-content/uploads/2019/09/17-Bernal-LibraryImpact.pdf
Bookstein, F., Seidler, H., Fieder, M., & Winckler, G. (2010). Too much noise in the Times Higher Education rankings. Scientometrics, 85(1), 295-299.
Bornmann, L., & de Moya Anegón, F. (2014). What proportion of excellent papers makes an institution one of the best worldwide? Specifying thresholds for the interpretation of the results of the SCI mago Institutions Ranking and the Leiden Ranking. Journal of the Association for Information Science and Technology, 65(4), 732-736.
Dobrota, M., Bulajic, M., Bornmann, L., & Jeremic, V. (2016). A new approach to the QS university ranking using the composite I‐distance indicator: Uncertainty and sensitivity analyses. Journal of the Association for Information Science and Technology, 67(1), 200-211.
Daraio, C., & Bonaccorsi, A. (2017). Beyond university rankings? Generating new indicators on universities by linking data in open platforms. Journal of the Association for Information Science and Technology, 68(2), 508-529.
Acknowledgments:
We would like to thank the Office of Institutional Research, especially Amit Prachand and Jason Ripple for leading this project, Professor Matthew Grayson for making us think out of the box and continuous motivation, support and encouragement. We would also like to thank our research advisor, Dr. Borchuluun Yadamsuren for propelling us to research, understand the problem better and achieve phenomenal results. Finally, we would like to thank Professor Diego Klabjan and the MSiA program staff for giving this opportunity to collaborate with OIR, which was a great experience and learning.