|By Brian Cai|
Overview
DJing has been a passion of mine since college. As a fervent follower of electronic and hip-hop music, I love the process of discovering new tracks, mixing them into a cohesive DJ set, and, if I’m lucky, connecting with an audience through my musical interpretations.
Throughout the years, I have observed DJ software evolve in terms of features for music manipulation, such as loopers, samplers, beat match, and filters. While all these features were built around how DJs can perform their music, little advancements have been made on providing DJs with insights on what music to play.
A key differentiator of a skilled DJ is their ability to blend different songs together into a cohesive set. By executing seamless transitions between songs, DJs can introduce the audience to new ideas while sustaining the energy and momentum of the dancefloor – i.e., keep the crowd dancing! Because two or more songs are simultaneously playing during a transition, DJs must develop an intuition for rhythmic and harmonic differences between songs to ensure that they blend well together.
Most DJ software compute two variables to help DJs assess these differences: tempo, in terms of beats per minute (BPM) and key, which describes a collection of notes and chord progressions around which a song revolves. While BPM is effective for evaluating rhythmic differences, key is often an unreliable variable for evaluating harmonic differences due to complexities within a song such as sudden key changes or unconventional chord progressions (i.e., songs in the same key are oftentimes not compatible). Furthermore, as key is a categorical variable, it cannot describe the magnitude of harmonic differences between songs.

Instead of relying on key, DJs could manually test the harmonic compatibility of song pairings prior to a performance. However, it is impractical to experiment with every possible song pair combinations of a substantial music collection. Even my collection of as little as ~150 tracks has over ten thousand possible pairs!
As my music collection continues to grow, I was inspired to develop more systemic and sophisticated approaches for uncovering harmonic connections in my music library. With the LibROSA and NetworkX Python packages and Gephi software, it is now easier than ever to experiment with music information retrieval (MIR) techniques to derive and visualize harmonic connections.
Through my exploration of data-driven DJ solutions, I was able to:
- Design a more robust metric (harmonic distance) to assess harmonic compatibility between songs
- Develop functionalities inspired by network theory concepts to assist with song selection and tracklist planning

From this analysis, I am convinced that the incorporation of more sophisticated analytical functionalities is the next frontier in DJ software innovation. By applying these data-driven solutions, I spent significantly less time rummaging through my music collection to find harmonically compatible songs and more time developing compelling and creative ways of mixing my music.
In this blog post, I will dive into the steps I have taken to extract and manipulate harmonic data from my audio files, derive and test my “harmonic distance” metric, and apply the metric to network theory concepts.
Designing a more robust metric for evaluating harmonic similarities
There are twelve chroma classes (i.e., pitches) that exist in music: {C, D♭, D, E♭, E , F, G♭, G, A♭, A, B, B♭}. With LibROSA’s chromagram computation function, I can extract the intensity of each pitch over the span of an audio file and calculated the overall distribution of each chroma class. My hypothesis: songs that share similar chroma distributions have a high likelihood of being harmonically compatible for mixing.
I first tested LibROSA functionality on a short audio clip, in which the chroma characteristics are easily discernable. The first 15 seconds of Lane 8’s remix of Ghost Voices by Virtual Self starts with some white noise followed by a string of A’s, then G – F♯ – E – D – G[1].
Ghost Voices (Lane 8 remix) – first 15 seconds
The chromagram function outputs a list of 12 vectors, each vector representing one of the 12 chroma classes and each values representing the intensity [0, 1] of a pitch per audio sample (by default, LibROSA samples at 22050 Hz, or 22 samples per second).
Using LibROSA’s plotting function, I was able to visually evaluate the audio clip’s chromagram:

LibROSA successfully captured the key distinguishable notes that appeared in the audio clip (yellow bars). However, it also captured quite a bit of noise (purple/orange bars surrounding the yellow bars). To prevent the noise from biasing the actual distribution of chroma classes, I set all intensity values less than 1 to 0.

While some of the white noise from the start of the audio clip were still captured, the noise surrounding the high intensity notes were successfully filtered out.
The chroma distribution of a song is then derived by summing the intensity values of all samples for each of the 12 chroma classes , then divided by the sum of all intensity values: 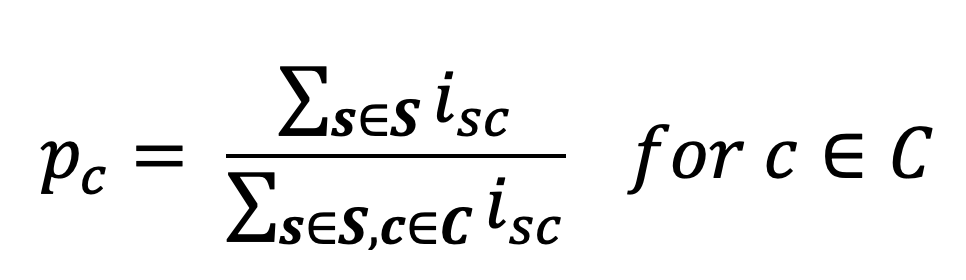
The impact of filtering out intensity values less than 1 was evident when comparing the chroma distributions between the filtered and unfiltered audio sample:
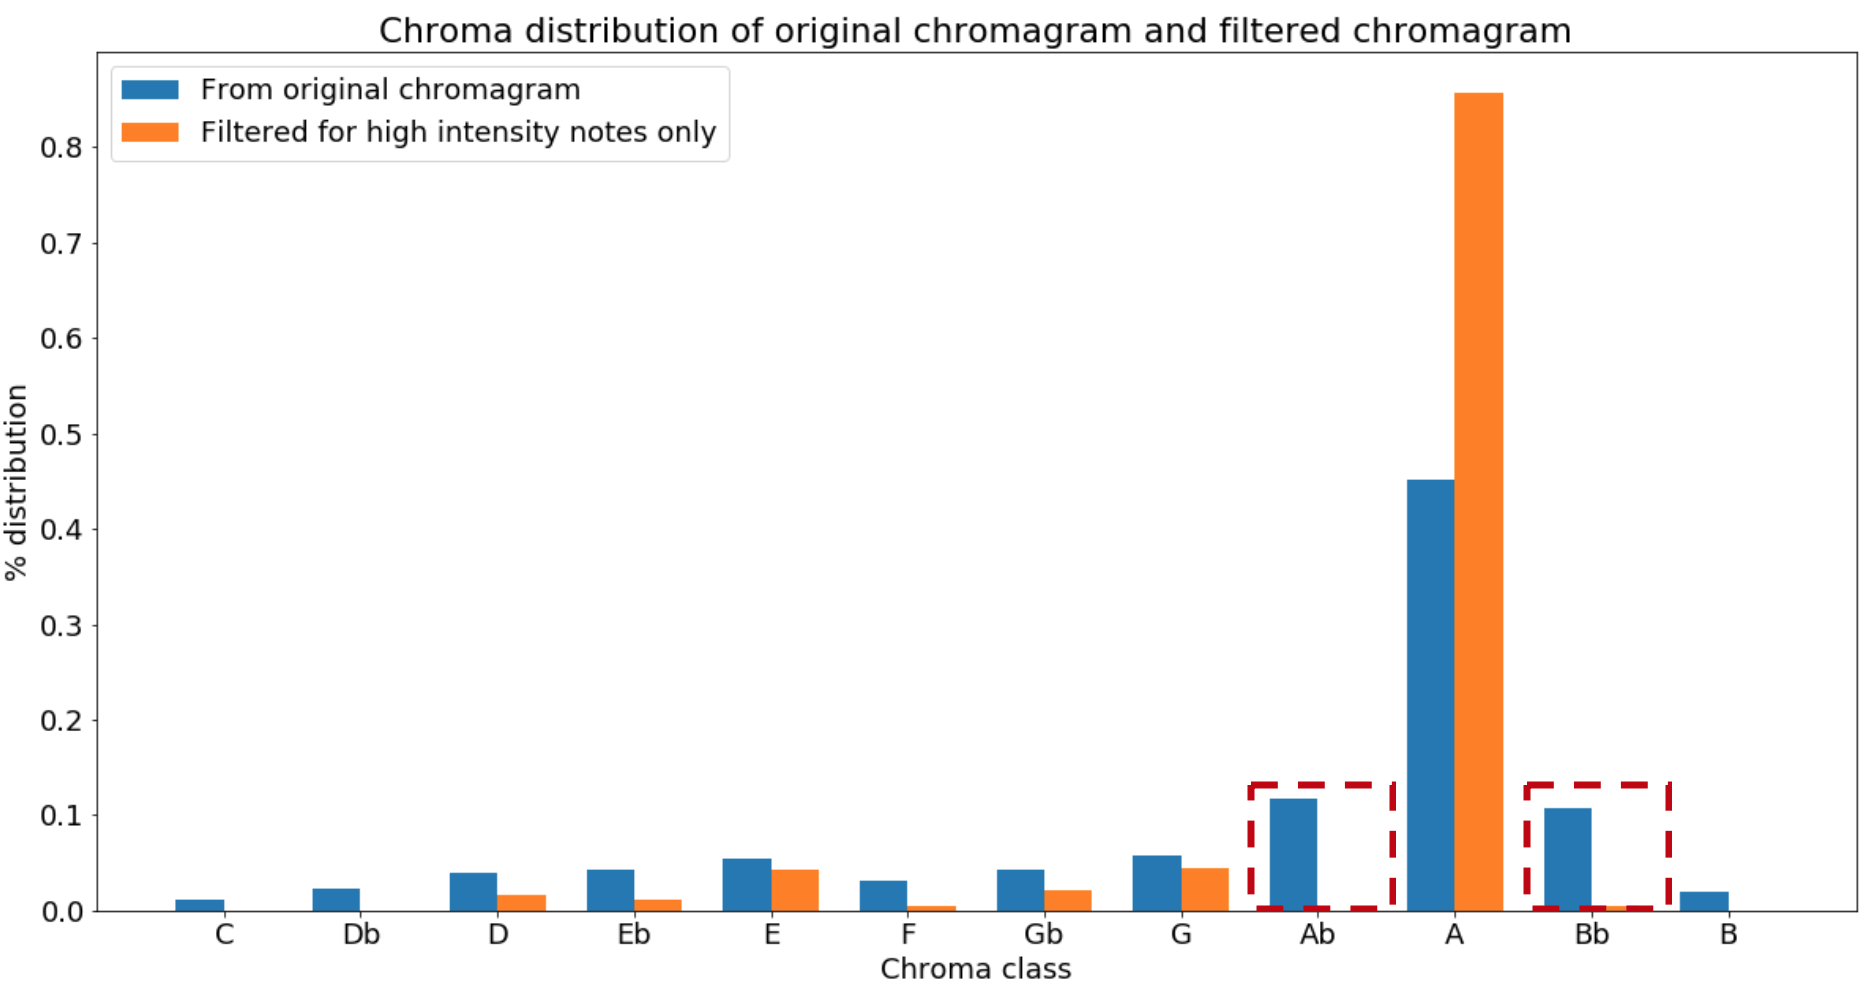
Note that the unfiltered distribution suggested that A♭ and B♭ were the second and third most common pitches from the audio clip, when in fact they were attributed to noise leaking from the string of A’s.
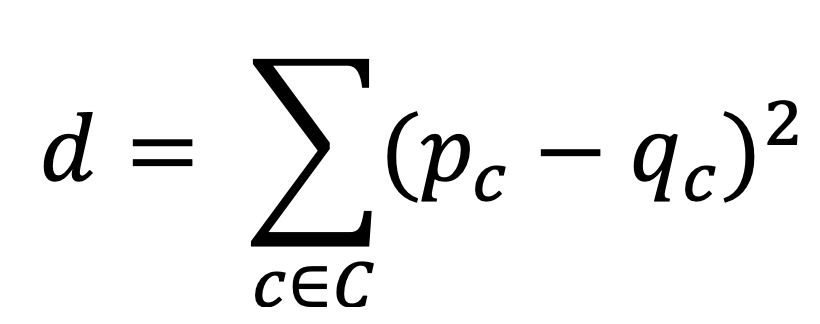
The harmonic distance between two songs can then be derived by calculating the sum of squares between their chroma distributions :
 By deriving the chroma distributions of all my music files, I can effectively calculate and rank the harmonic distances of all possible song pair combinations in my library and prioritize the exploration of pairs with the smallest harmonic distances.
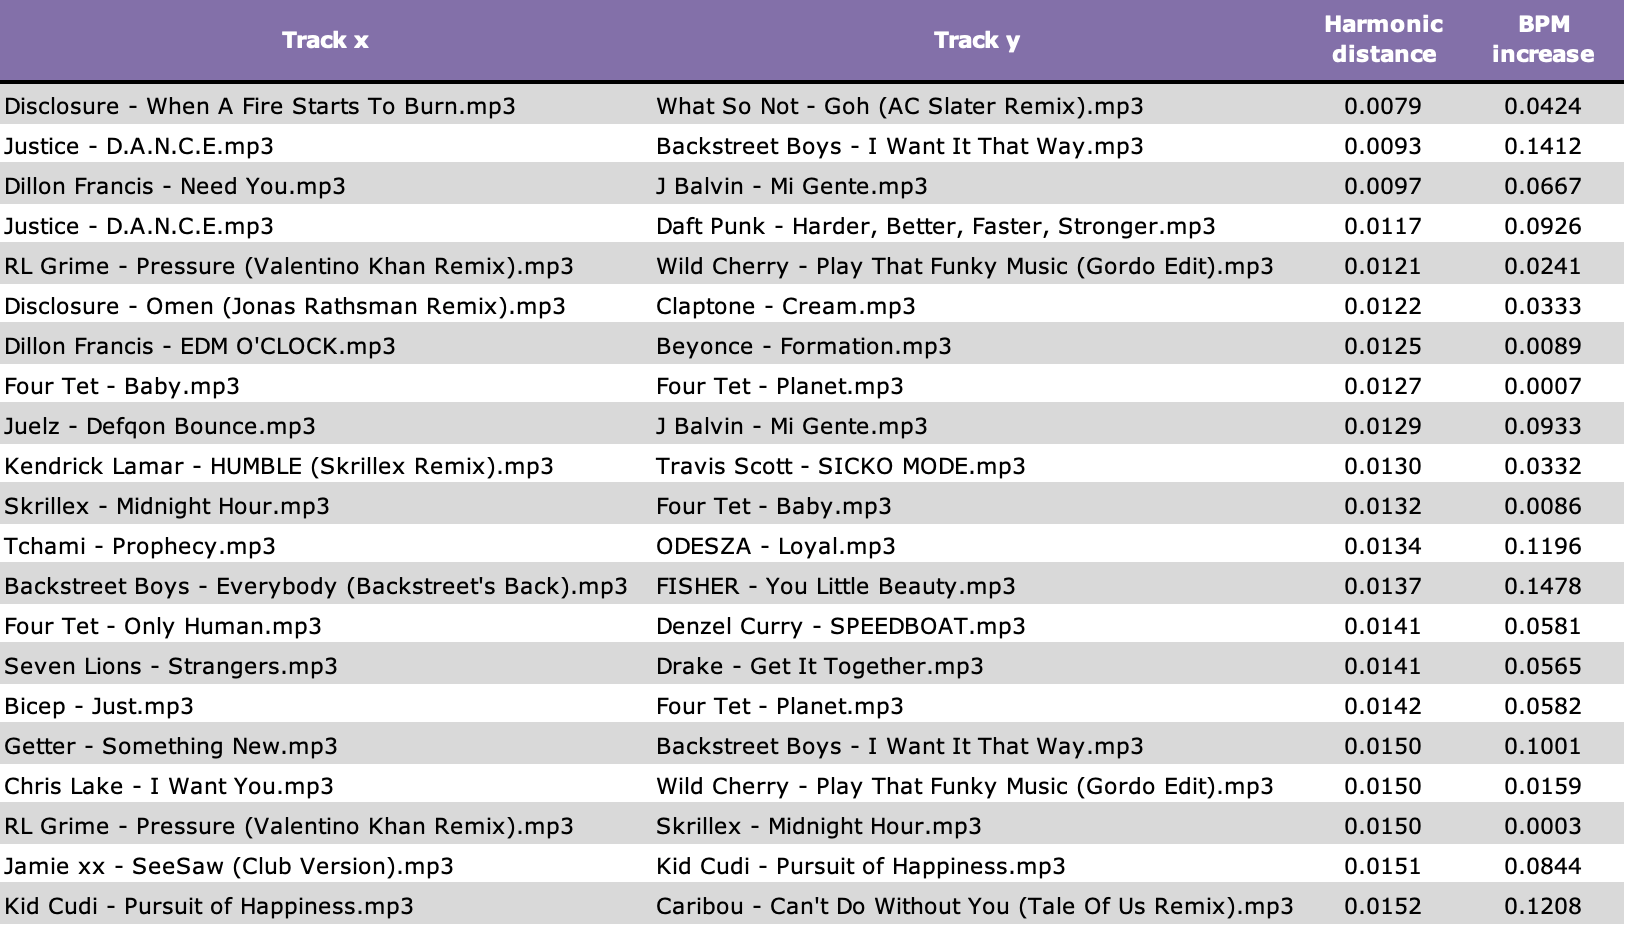
One of the more unexpected pairs at the top of the list was I Want It That Way by Backstreet Boys and Flashing Lights by Kanye West. These songs share four of their top five chroma classes and have a harmonic distance of 0.016, which falls in the ~0.5% percentile of ~10k pairs:


Despite the fact that these songs have very few commonalities in terms of style, mood, message, etc., they share a striking resemblance in terms of harmonic characteristics. Here is a mashup I made of the two songs:
I Want It That Way x Flashing Lights mashup
Testing the performance of the harmonic distance metric
To test the effectiveness of this harmonic distance metric, I evaluated 4 sets of 25 song pair recommendations generated from the following models:
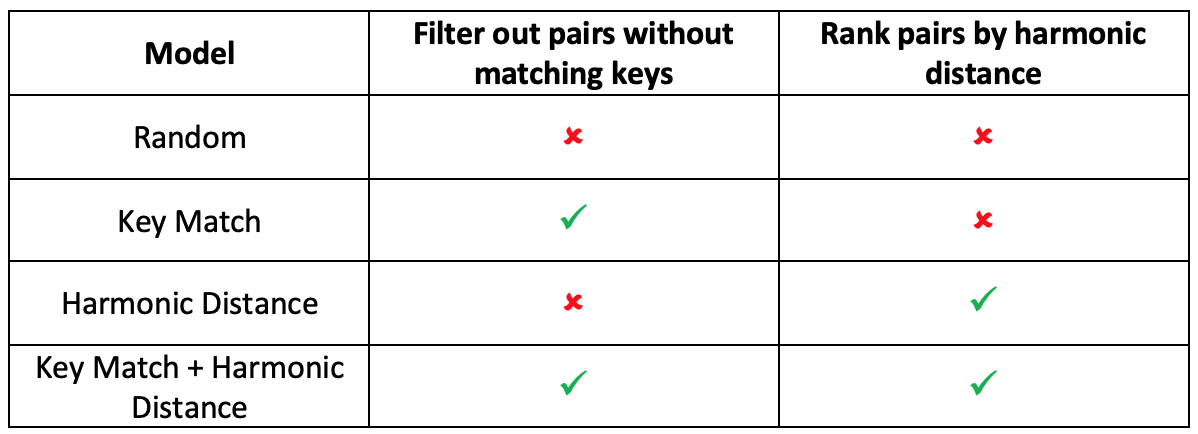
To generate recommendations, I first pulled each song’s BPM and key from the Spotify Web API via the Spotipy library. I then calculated the percent difference in BPM between all song pair combinations and filtered out any pairs with differences greater than 15% to ensure that all recommendations are at least rhythmically compatible[2]. For models with Key Match, I filtered out any pairs that were not in the same key. For models with the ranking feature, the top 25 pairs were selected based on smallest harmonic distance. For models without ranking, 25 pairs were randomly selected after applying filter(s).
In the evaluation of each recommendation, I attempted to create a mashup of the two songs with my DJ software and equipment. If I was able to create a harmonically agreeable mashup, I assigned a compatibility score of 1, else 0.
After scoring all recommendations, I compared the total and unique pairs of compatible songs across each model:
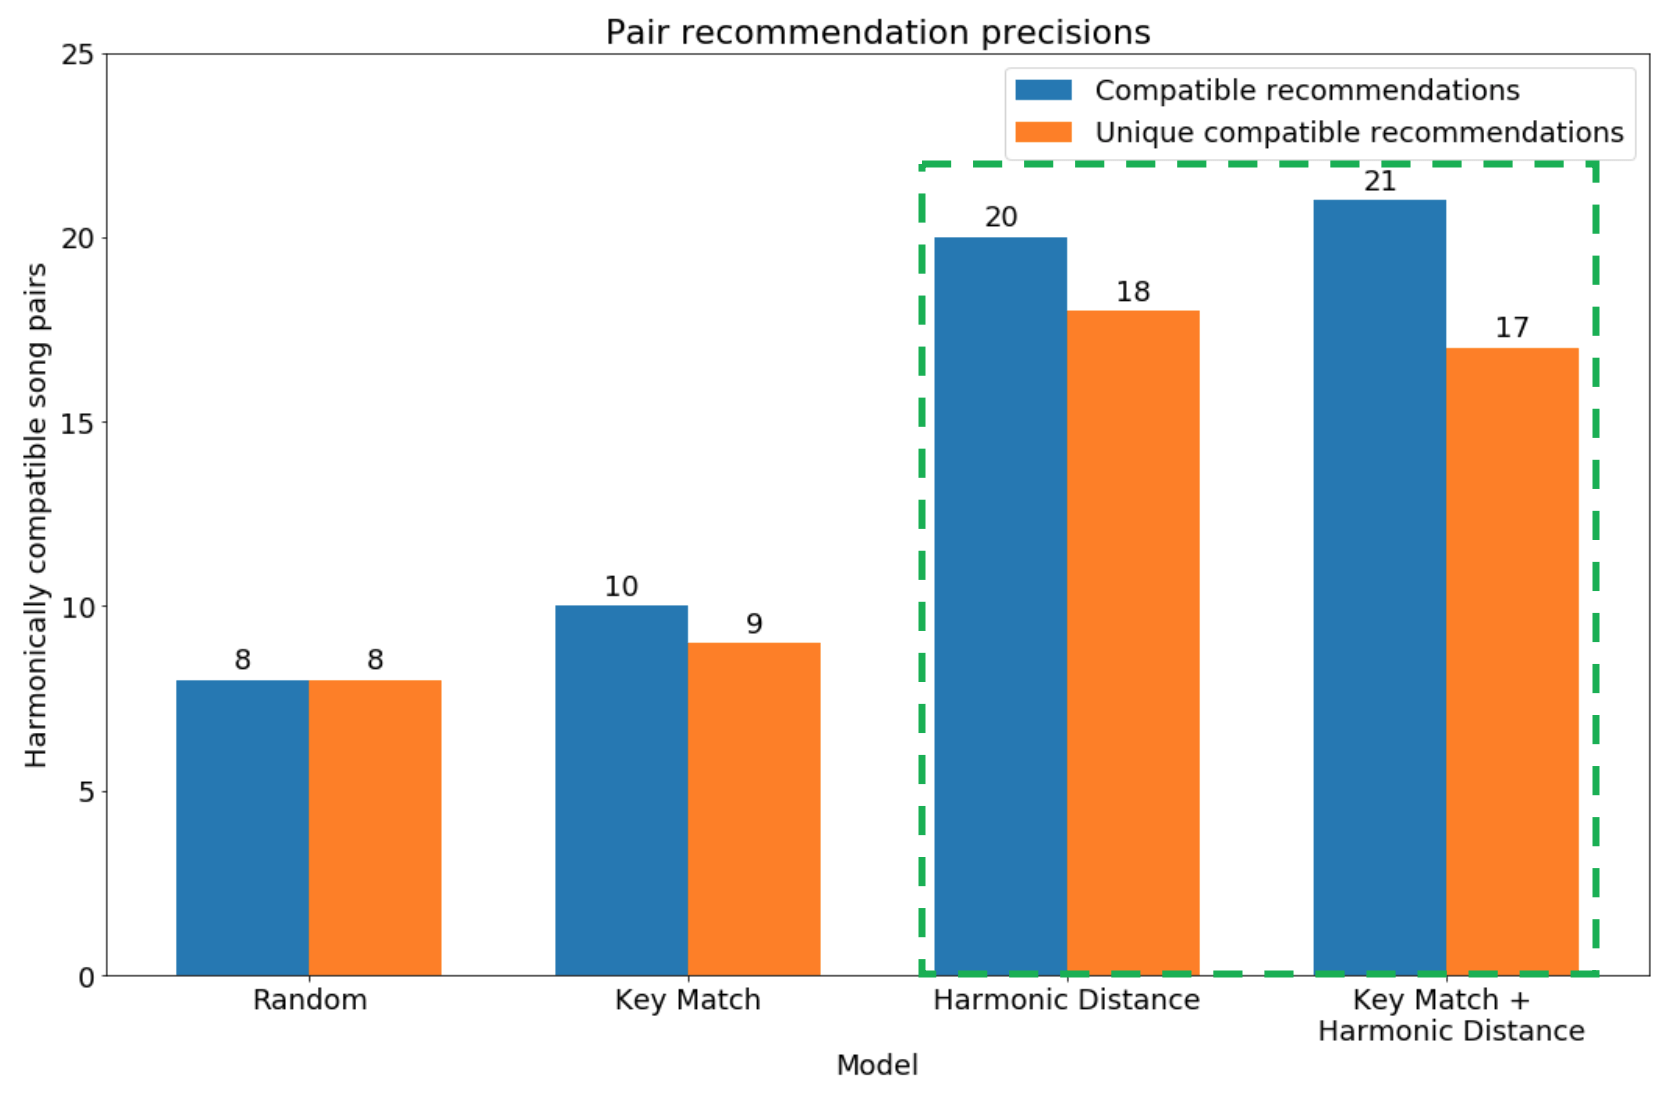
As expected, Random performed the worst while the full model, Key Match + Harmonic Distance, performed exceptionally at identifying compatible pairs. Harmonic Distance by itself also performed well, generating nearly the same number of compatible pairs as the full model.
Unfortunately, Key Match showed little improvement over Random. While recommendations from Random may have had a higher number of harmonic connections by chance, it is more likely that Spotify’s key detection algorithm generated too many inaccurate predictions. Out of 57 pairs that Spotify metadata predicted were in the same key, my DJ software only believed 25 of which were actually in the same key. While it was unclear which algorithm was more accurate, this highlights the fact that key predictions algorithms tend to have varying degrees of success.
It is important to note that Harmonic Distance and Key Match + Harmonic Distance combined found 39 harmonically compatible pairs out of 48 unique recommendations. Thus, harmonic distance can not only uncover harmonically compatible pairs but also enhance the utilization of key detection algorithms. In analyses of future music libraries, I will certainly evaluate recommendations from both models.
From the Key Match + Harmonic Distance recommendations, my favorite mashup that I made was with Pony by Ginuwine and Exhale by Zhu:
I was pleasantly surprised by not only their harmonic compatibility, but stylistic compatibility as well.
Reimagining my music library as a network
The potential of using harmonic distance for DJing really comes to life when the data is applied to network theory concepts. With the top 5% song pairs by harmonic distance, I used the NetworkX package to construct an undirected network with nodes as songs, edges as harmonic connections between songs, and edge weights as harmonic distances.
In addition, I calculated the eigenvalue centrality score of each node to evaluate the most important songs based on their connection to other songs with high number of harmonic connections.
With the Gephi software, I created an interactive visualization of this network:

This visualization is formatted such that node size and shade were relative to the eigenvalue centrality score and edge thickness was relative to harmonic distance. Larger and darker nodes represent songs with higher eigenvalue centrality scores. Thicker edges represent greater harmonic distances between songs.
With this visualization, I can make more strategic choices with song selections during a DJ set, as I can evaluate harmonic neighbors of any given track in real-time and be cognizant of “versatile transition tracks”, or tracks that can lead to many transition options.
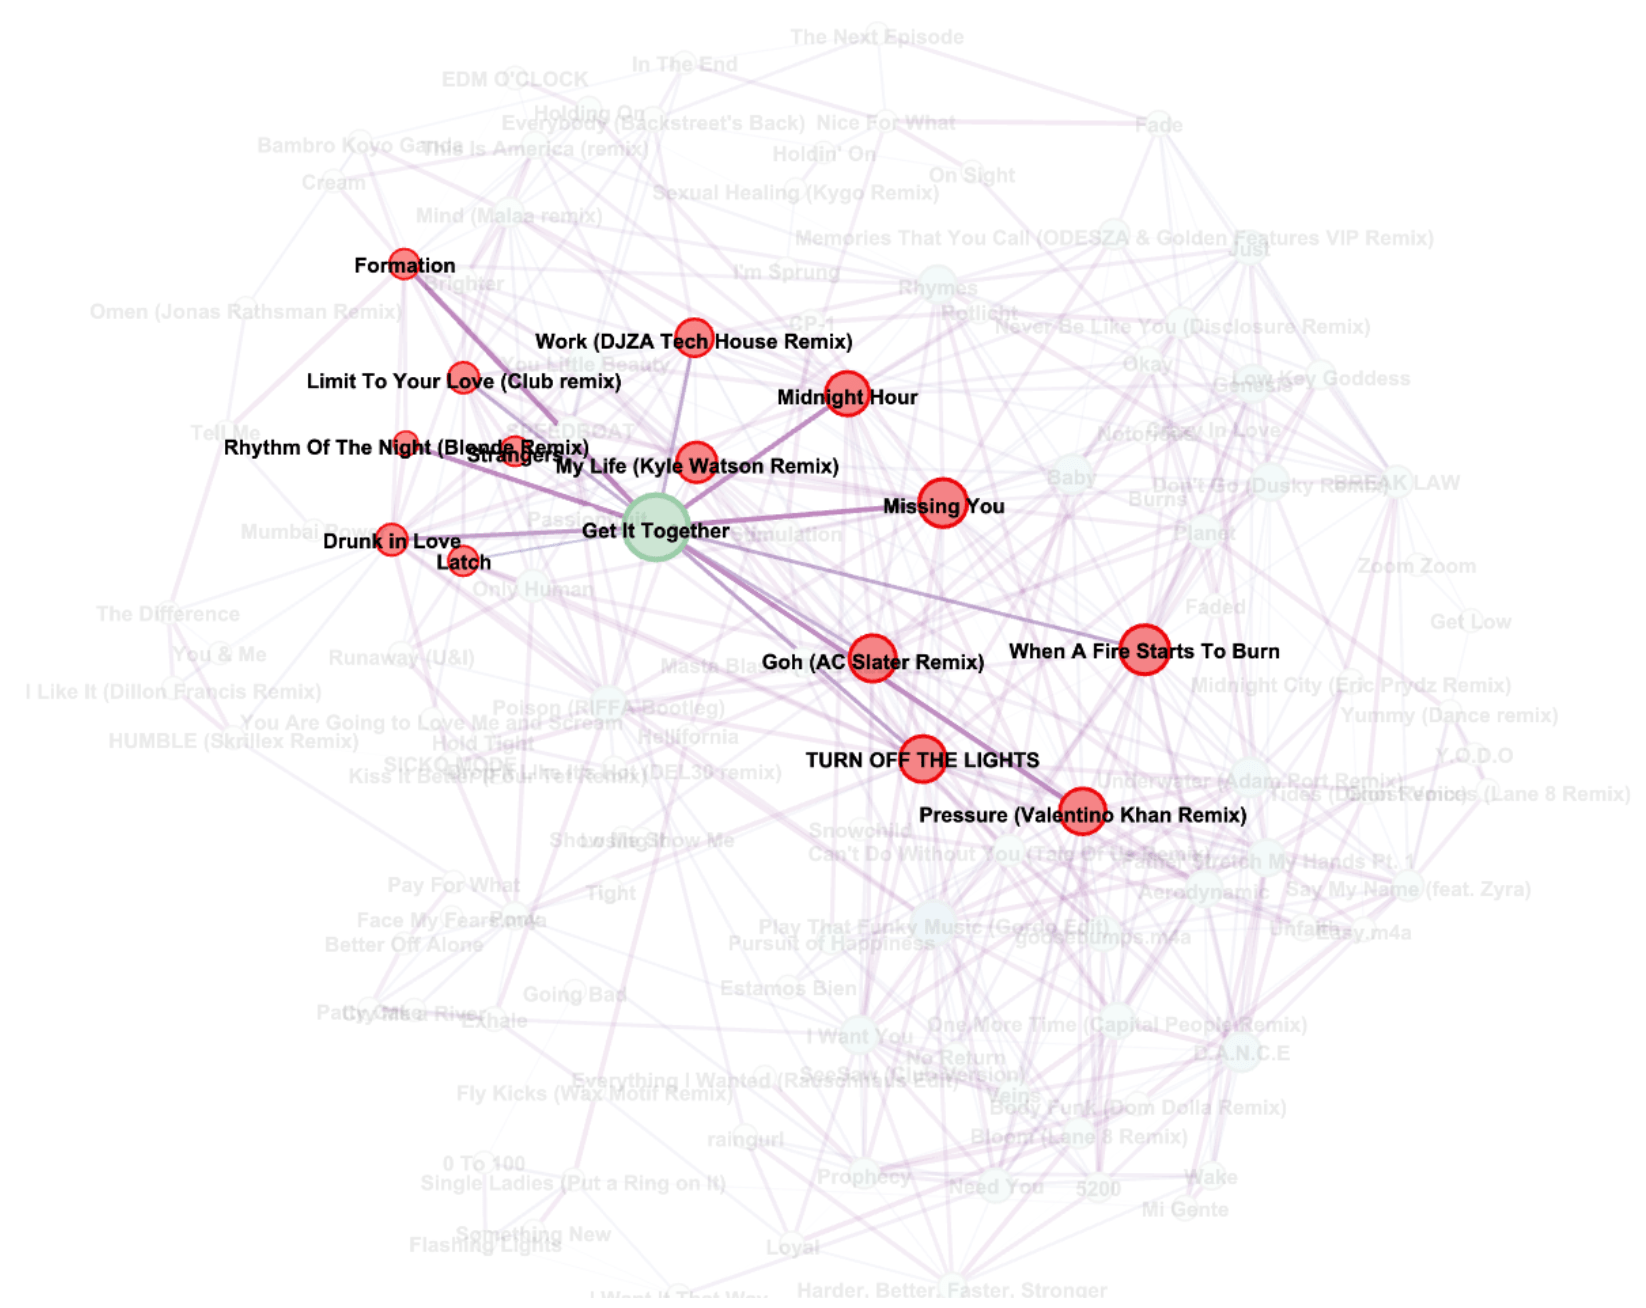
The shortest path concept of network theory is also applicable in the context of DJing. Say I’m currently playing Formation by Beyoncé and want to transition to Say My Name by ODESZA, but the two songs are too harmonically dissimilar for an immediate transition. With Dijkstra’s Shortest Path algorithm, I can find the shortest weighted path to Say My Name, in which each transition would sound harmonically agreeable.
Finally, the shortest path concept can also assist with creating a tracklist for performances. Say I have been tasked to perform a 1-hour set of ~20 songs. With my network, I can algorithmically construct a path of 20 unique songs that minimizes harmonic distance. To solidify my experiments into a creative piece of work, I ran this algorithm a few times, each time starting with a random song. Out of the iterations, I picked the tracklist I found most compelling and mixed the songs into a continuous DJ set. Because all adjacent songs in the tracklist were harmonically compatible, I was able to fully extend my mixing capabilities to create seamless and elaborate transitions between songs. Furthermore, mood, style, or genre were not taken into account when creating the tracklist, so there was a sense of randomness with the song selections that really contributed to the novelty of the set.
Conclusion
With the lack of song analysis and recommendation capabilities in today’s DJ software, I believe that these features can be key differentiators for next generation DJ platforms:
- A more robust metric for evaluating harmonic distances
- An interactive visualization to explore harmonic connections
Throughout the development of these features, I have gained a much deeper understanding of my music library, uncovered novel mashup possibilities, and created my most technically advanced DJ set to date – accomplishments that any DJ, professional or enthusiast, would strive for in the advancement of their craft.
The key challenge of this experiment was evaluating the effectiveness of the harmonic distance metric. Firstly, evaluating the accuracy of the recommendations is time consuming, as each recommendation must be tested manually by the DJ. Secondly, the compatibility of the recommended pair may be subjective to DJ’s interpretation and technical ability (e.g., a more experienced DJ can create more nuanced mashups that are harmonically agreeable). It would be ideal to have multiple DJs test my solutions on their respective libraries and provide feedback on their effectiveness.
As there are plenty of future work for this analysis, I look forward to continue refining my features and hopefully bake them into DJ software so that other DJs can incorporate data-driven solutions into their performances.
Future work
- Reproduce analysis with a completely different music library
- Evaluate computation time and model accuracy from reducing the sampling rate for chroma computation; it currently takes 1.3 hours to compute 2 GB worth of music at 22 samples per second
- Derive chroma distribution across different sections of a song (e.g., intro, verse, chorus) to make more granular comparisons
- Test alternative metrics for harmonic distance, e.g., a rank-based approach in which a score is generated based on the number of shared chromas between each song’s top 5 most common chroma classes
- Build front-end interface to load music files, generate visualizations, and obtain recommendations
Resources
Repository: GitHub
Python libraries:
Network visualization: Gephi
DJ software: Algoriddim djay Pro 2
DJ equipment: AKAI MPK25, Numark Mixtrack Pro 3
[1] F♯ is synonymous to G♭; F♯ is the proper notation in the key of G major
[2] The 15% threshold is based on my prior DJing experience – I find that songs lose their stylistic integrity if their tempo is increased or decreased greater than 15%.