|By Saurabh Annadate & Tanya Tandon|
This paper was written to record our experience as the 2nd place winners and recipients of a $15,000 reward in the 2019 Humana-Mays Healthcare Analytics Case Competition amongst 480 participating teams from across the US.

Heather Cox (Chief Digital Health and Analytics Officer, Humana), Saurabh Annadate, Tanya Tandon, Arvind Mahajan (Associate Dean for graduate program, Mays Business School, Texas A&M University)
COMPETITION DETAILS
The 2019 Humana-Mays Healthcare Analytics Case Competition involved two levels of submissions and three rounds of evaluation. For level one submissions, we were required to develop a predictive model, score a holdout dataset and provide an analysis write-up. For level two, we had to present our findings to a panel comprising of Humana executives and Mays Business School faculty.
- Round 1: Top 50 teams were selected amongst 480 participating teams based on the accuracy of the scored dataset
- Round 2: Top 5 teams were selected amongst the top 50 teams based on the analysis report
- Round 3: The winners were selected amongst the top 5 on the basis of their final presentations which took place in Houston, TX

PROBLEM STATEMENT
Humana is a leading healthcare company that offers a wide array of insurance products and health and wellness services. It serves over 15 million members nationwide. The aim of this study was providing Humana a better understanding of Long-Term Opioid Treatment (LTOT). LTOT is a phenomenon where a doctor’s prescription of opioids for pain or other illnesses leads to a long-term usage by the patient which eventually leads to addiction. Our goal was to develop a classification model to predict the likelihood of a patient experiencing LTOT in the future using the data of their prior touchpoints with Humana. In addition to this, we wanted to extract actionable insights and evaluate key indicators aligned to Humana’s business needs.
LTOT is not only a personal havoc for patients which disrupts their lives but also a huge financial burden on Humana. This study’s mission is to develop a solution to mitigate both effects.
WHY SHOULD THIS PROBLEM BE SOLVED?
Prescription opioid abuse is a colossal problem in the United States. A recent study conducted in 2017 [1] reports that 11.1 million prescription opioids were abused in the previous year alone. It is also reported that there were 47,600 opioid overdose related deaths in that year, which accounted for almost two-thirds of all drug overdose deaths. Furthermore, prescription opioid abuse begets a much larger problem – it is reported that 4% – 6% of those who misuse prescription opioids transition to heroin, which is very worrisome.
Looking at the financial aspect of this problem, a 2013 study reports that the total annual burden of prescription opioids abuse on the entire US healthcare ecosystem is $26 billion [2]. Another study based on test and control groups show that the 2-year per person burden for treating opioid dependence on a payer is ~$23,000, which is significant [3].
As it is seen from the above numbers, the problem that we are tackling at hand is massive and the impact of developing a solution for the same will be tremendous. But how can we solve this problem?
CMS reports that as many as 1 in 4 patients receiving long term opioid therapy in a primary care setting will struggle with opioid addiction and dependence. Research also suggests that early opioid prescribing patterns including the frequency of prescriptions as well as the total Morphine Equivalent prescribed are directly associated with long term opioid use and potential for abuse [4]. Lack of enough data on how long and what dosage of opioid is safe to be prescribed to a particular patient at clinicians’ behest is a major deterrent to prevent long term opioid use. Even when the data is available, it is not readily consumable by clinicians who are sole decision makers of prescription decisions.
Hence, it is imperative for proactive identification of individuals who are at a higher risk of getting addicted to opioids for tracking and appropriate servicing and making this information available in an easily digestible way to the decision-making stakeholders. This will not only help improve the well-being of the members but also reduce the cost burden on the individual as well as the payer.
WHAT IS THE SOLUTION?
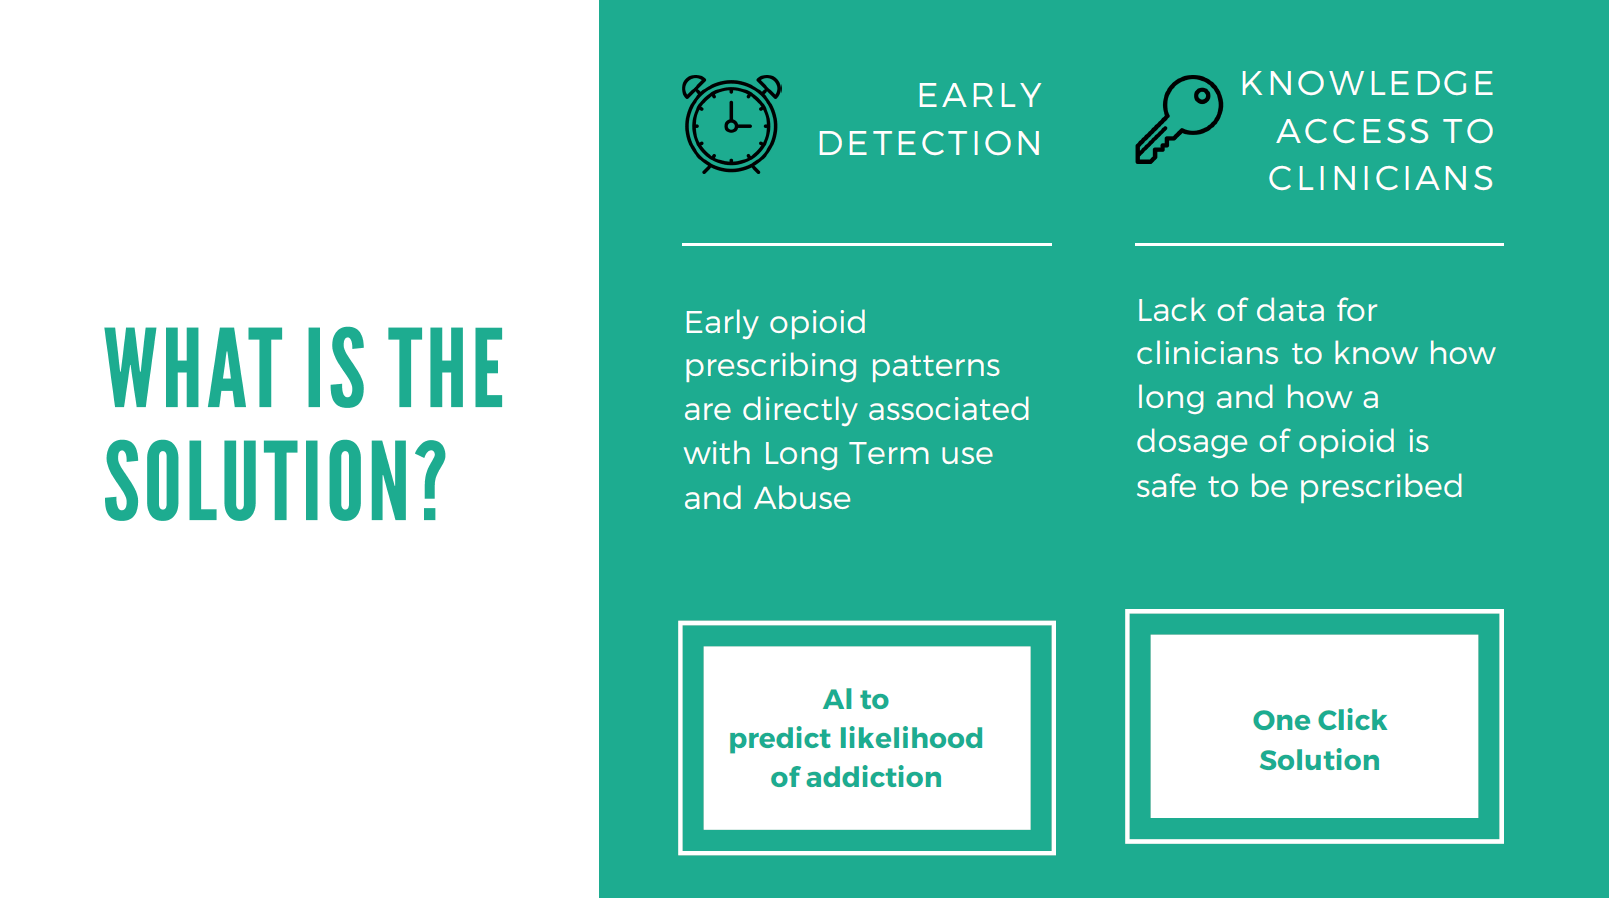
We proposed and built a two-fold solution for this problem (Figure 2):
- Early Detection of LTOT: Developing a predictive model by leveraging machine learning to identify at-risk individuals for Long Term Prescription Opioid use
- One-click solution: Building a one-click platform for stakeholders such as Doctors and Humana staff to access personalized patient information so that appropriate action can be taken
HOW DOES THE SOLUTION IMPACTS STAKEHOLDERS?

As established earlier, Prescription Opioid Abuse is a pertinent problem to tackle. Our developed solution will help Humana identify patients at risk of LTOT and take directed measures to prevent potential future abuse and addiction. Implementing preventive measures will also help Humana save millions of dollars in opioid treatment as well as administration costs. Furthermore, this will enable the providers to make better informed decisions which will drive higher patient satisfaction rates. Lastly, but most importantly, patients will experience better health outcomes and lower healthcare costs as depicted in Figure 3.
METHODOLOGY OF THE ANALYSIS
1. Dataset
To perform this analysis, we were given a 4-years long longitudinal view of events for MAPD members currently enrolled with Humana. The dataset had ~6mn records and 20 columns. Data for 16 different types of events including calls, medical claims, diagnoses, provider, and pharmacy claims with each event having its own set of attributes was provided. The time stamps were relative with the anchor point being the first naive opioid event observed post the first year and having the time stamp as Day 0. A naive opioid event is defined as the patient getting an opioid prescription while not having had opioid on hand for 90 days prior. We had the data for 14,000 deidentified unique patients.
Exploratory Data Analysis was performed to understand the distributions as well as data quality. Several quality issues and nuances like multiple prescriptions on the same day, missing Day 0 records, missing dosage volumes etc. were identified and highlighted.
2. Computing Target
Our aim was to understand whether there is an occurance of an LTOT event post a naive opioid event. As mentioned before, an LTOT event is defined as having opioid on hand for at least 90% of days in the 180 days period post a naive opioid event. A naive opioid event is defined as the first prescription of opioid by a doctor for pain or any other illnesses. There are different ways an LTOT can occur after the naive opioid event (Day 0) has occurred. Figure 4 illustrates the two cases where LTOT was observed. In case 1, an LTOT event is observed for the opioid naive event at Day 0 itself since the patient has opioid on hand for >90% of days within the 180 days period post Day 0. In case 2, LTOT is not observed for the first naive opioid event, however is observed for a naive opioid event occurring at Day 120. For all occurrences of such cases, the target for modelling was set as 1, and rest as 0.
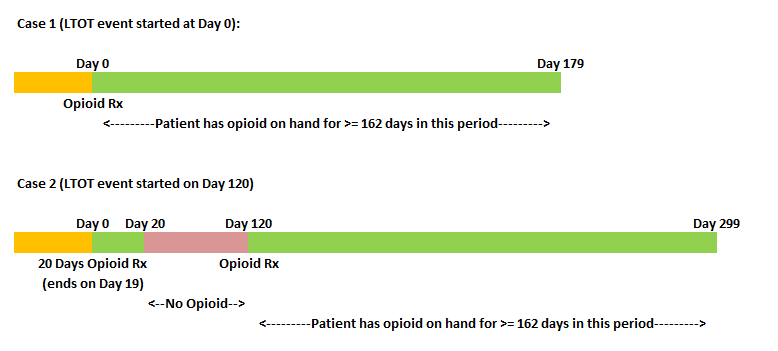
We observed that the incidence of LTOT in the training data was ~46%. Hence, it was a fairly balanced dataset.
3. Feature Engineering
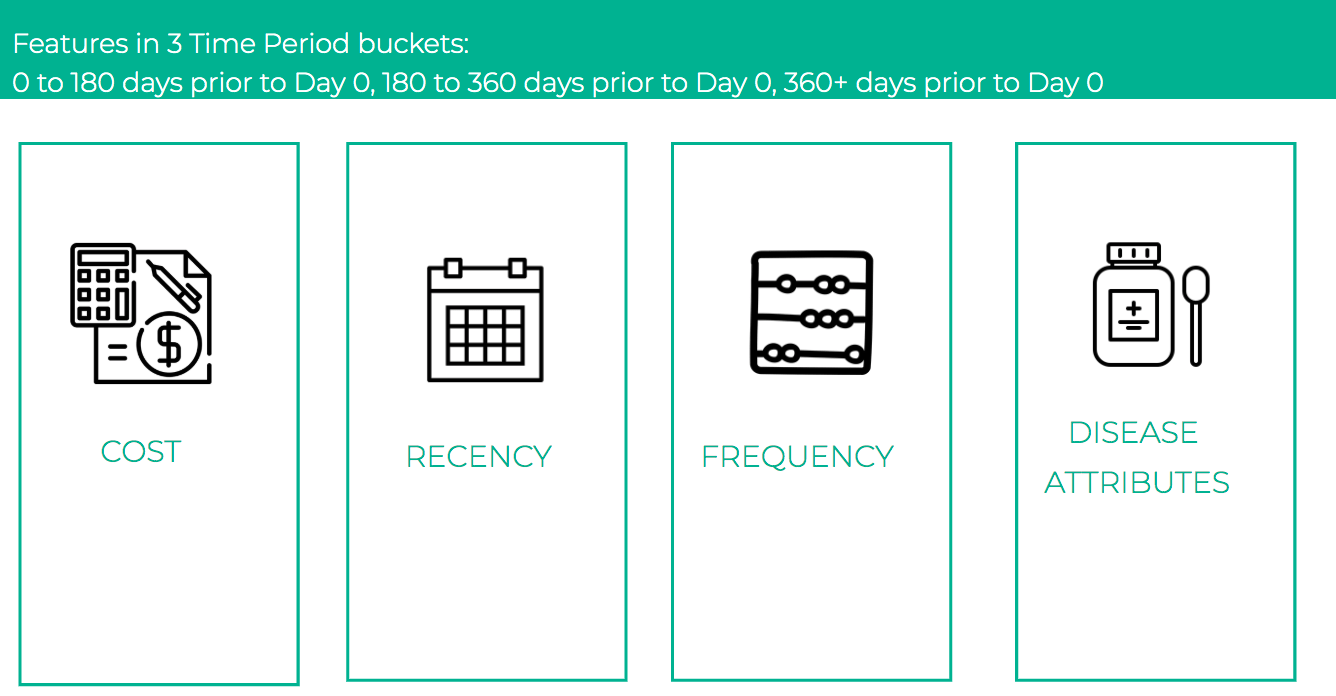
For feature engineering, we explored and extracted features from each of the sixteen types of events – prescription, change of doctors, new disease etc. which could be reflective of the patient’s behavior. The features generated broadly fell under the constructs of cost, recency and frequency. Literature review also indicated that incidence of certain conditions like anxiety, depression, heart disease, etc. were good indicators of future opioid abuse [5]. Hence, on the basis of the presence of certain keywords in the claim descriptions, we extracted disease specific attributes to capture these nuances. A total of 479 features were constructed. For most of the features which included aggregation across time, we defined three different time buckets, and aggregated the features for each of these. The time buckets were:
- 0 to 180 days prior to Day 0
- 180 to 360 days prior to Day 0
- 360+ days prior to Day 0
As shown in Figure 5, all of our features fell into 4 buckets: costs, recency, frequency and disease attributes with an added dimension of time.
4. Modeling
After computation of our target and engineered the features, the next step was modelling. In order to quickly iterate through different models and hyperparameter sets, we utilized the open source automated machine learning module of H2O.ai. This module provided an API to automatically fit Random Forests, Extremely Randomized Trees, Logistic Regression and Gradient Boosting trees (both XGBoost and H2O implementation) on our final processed patient level dataset and performed random grid hyperparameter search and 5-fold cross validation to ascertain the best performing model. Since our problem was a binary classification problem, the objective function that was minimized was binary cross-entropy. The top performing model was a XGBoost gradient boosting tree classifier. The modelling workflow is depicted in Figure 6.
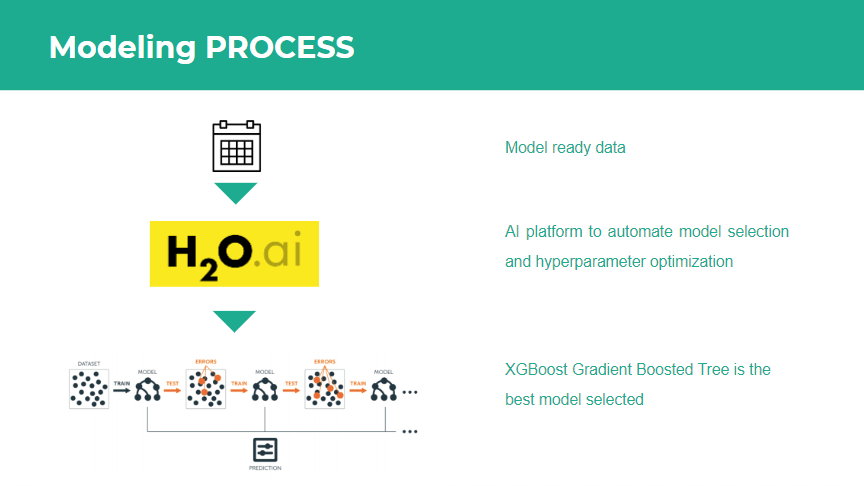
Table 1 shows the performance metrics for the model. All metrics are average 5-fold cross validation metrics. As we can see, the model has an area under the ROC curve of 0.8045 which indicates that the model has a good performance. Furthermore, it also has good overall accuracy, precision, recall and F1-score. We wanted to check how the model would perform if we only take the top 20 variables as identified by the feature importance from the model.
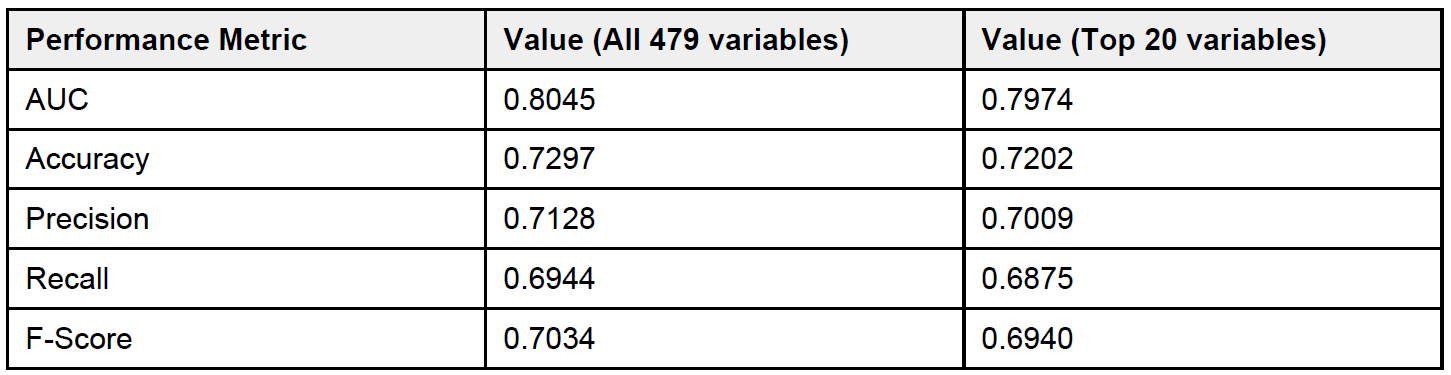
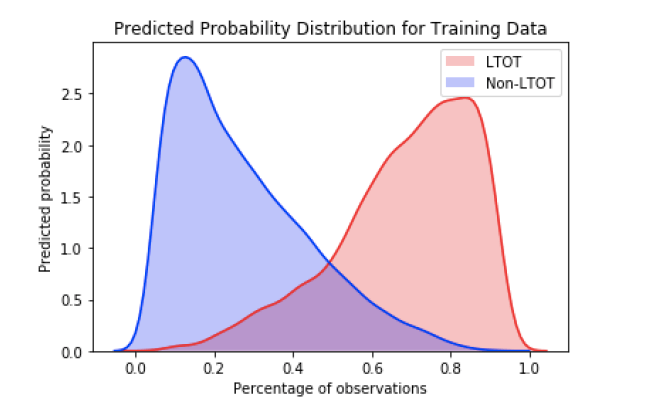
And as we can see, the model performance does not degrade if we consider only the top 20 variables indicating that these variables provide the maximum signal. Furthermore, a look at the probability distributions for the training data as shown in Figure 7 reflect the findings that the model is doing a good job of classifying a particular patient as LTOT probable or not.
RESULTS OF THE ANALYSIS
In order to interpret the effects of the different features on the probability of LTOT, we decided to use the SHapley Additive exPlanations (SHAP) plots. Following are the top 20 most impactful features as identified by the algorithm:

Shapley Tree plot and individual variable dependence plots were analyzed to study the impact of these variables on the probability of a patient to experience Long Term Opioid Use post initial prescriptions.
INSIGHTS
Following are the key takeaways:
- Having a history of pain related pharmacy claims and specially prescription opioid pharmacy claims is an extremely good indicator of future LTOT behavior which aligns with the literature review
- Patient activity in Time period 180 days+ prior to Day 0 is the more impactful in determining LTOT than the most recent 6 months
- Having Anxiety, Depression, Neuro, Antibiotic or Cardio pharmacy claims in the most recent one month influences future LTOT behavior which aligns with the research findings
- If the patient has had surgery in the most recent one month prior to the naive opioid event, it would influence the LTOT probability
ONE CLICK SOLUTION
Now that we had developed our model, we wanted to develop a solution to make the model readily available for utilization by the decision-making stakeholders. For the same, we developed a proof of concept for an application in Python Flask which served as a one-click solution to ingest data, train model, provide predictions and track model performance. We named the application Patient+ and Figure 8 illustrates the home page of the application.

We developed three modules of functionality in our application –
- Patient Score: This module was the main information retrieval engine of the application which provided the LTOT probability, top 5 most impactful variables and the recommended action on the basis of the patient ID. Figure 9 illustrates the Patient Score user view
- Model Details: This Module contained all the model performance metrics and the model interpretability charts
- Retrain Model and Batch Predict: This module provided a one-click solution to retrain the model using new data or predict probabilities for new set of patients

FUTURE SCOPE
While the analysis provides a lot of insights and a potential solution to tackle LTOT, we have identified a few steps that could improve our solution:
- Inclusion of demographic data: Demographic data like income, ethnicity etc. could be good indicators of potential opioid abuse and should be evaluated for inclusion in the model. A key point to note is to check for biases in the model while working with demographic data
- Including full prior history for the patients: Any predictive model benefits with more data. Inclusion of the full prior history of a patient will provide better insights into the patient behavior which may help in improving the model performance
- Studying interaction effects of the variables: Further analysis can be conducted on the variable impact on the LTOT probability to evaluate the interaction effects
- Generating features at a higher time granularity: Currently, the features are bucketed into three time buckets (as highlighted in the Feature Generation section). Generating features at a higher level of time granularity e.g. at a month level may provide further lift and help gain deeper insights into the variable impacts and patient behaviors
RECOMMENDATIONS FOR IMPLEMENTING Patient+
- Model Lifecycle
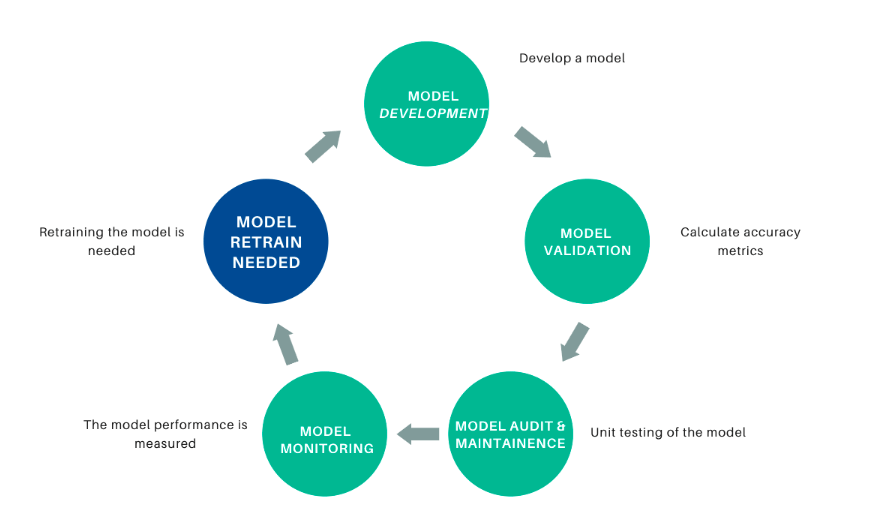
As time passes and new data is administered, the underlying data relationships can change and the model performance can degrade. To prevent the model from being unusable, the model performance should be tracked and the model retrained using new data if the performance degrades. Figure 10 depicts the model lifecycle.
- Model Validation
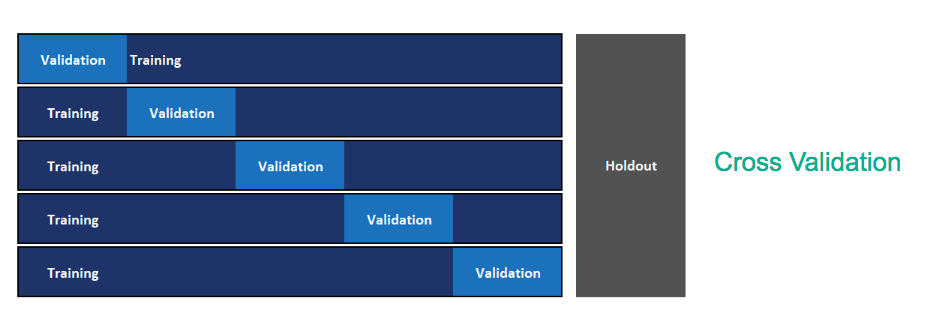
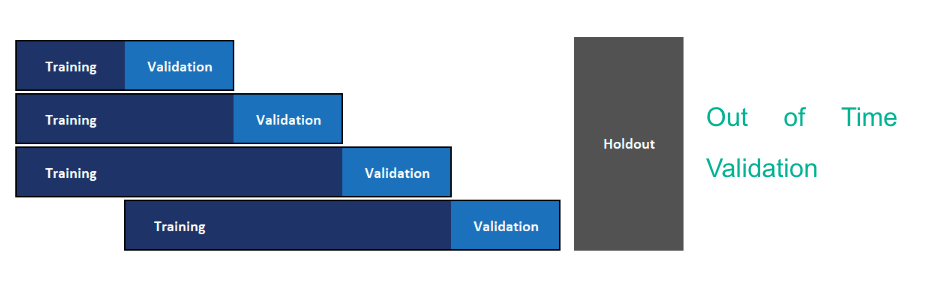
The current model is built using the method of cross-validation for model hyperparameter optimization and model selection. Since we need to use past data to predict future, this methodology may not yield a good model to predict on future data. We recommend implementing out-of-time validation to tackle the same wherein the validation set is constituted of future data points. The current format of the data with actual dates masked was not conducive to conduct this. Figure 11 and Figure 12 depict cross validation and out-of-time validation respectively.
REFLECTION ON THE EXPERIENCE
Tanya: I thoroughly enjoyed solving the problem and building an end-to-end reproducible and readily deployable ML solution for Opioid addiction. I felt a strong sense of accomplishment, bigger than the spirit of competition to help solve the epidemic of opioid addiction. In addition to this, my curiosity for solving healthcare problems piqued because of the fulfillment it provides. Besides learning more about healthcare and ML, I enjoyed representing Northwestern and meeting brilliant people in Data Science from across the US. I also wanted to give a big shout out to Team Texas A&M and Team Humana for a smooth execution of the competition and supporting the participants throughout. I would encourage any and everyone interested in solving data science problems to participate in this competition, it’s extremely rewarding.
Saurabh: It was an absolutely amazing experience preparing for the case for over a month and being selected to present it to the executive panel. All the steps involved including understanding the problem, conceptualizing the solution, and building something that would be of direct value to Humana added to the experience. Furthermore, it felt very fulfilling to have got the opportunity to create a solution that targets a very pertinent problem and would potentially impacts thousands of lives. A big thank you to Humana and Texas A&M University – Mays Business School for hosting the competition and to the administrative team for the smooth execution. It was a rewarding journey for me, and I am looking forward to more such avenues in the future.
ACKNOWLEDGEMENT
We would like to thank Humana Inc. and Texas A&M Mays Business School for organizing the competition and providing us with the opportunity to work on the problem. A big shout out to the administrative team for the smooth execution and student partners – Samuel Pete, Cory Stockhoff and Ally Mullen for their kind assistance with everything.
REFERENCES
- Office of the Assistant Secretary for Health (2019). The opioid epidemic and emerging public health policy priorities. Retrieved from https://www.ama-assn.org/system/files/2019-02/19-nac-opioid-epidemic-presentation_0.pdf
- National Institute on Drug Abuse (2019) Opioid overdose crisis. Retrieved from https://www.drugabuse.gov/drugs-abuse/opioids/opioid-overdose-crisis
- Scarpati, L. M., Kirson, N. Y., Jia, Z. B., Wen, J., & Howard, J. (2017). Opioid abuse: A detailed examination of cost drivers over a 24-month follow-up period. Journal of managed care & specialty pharmacy, 23(11), 1110-1115.
- Deyo, R. A., Hallvik, S. E., Hildebran, C., Marino, M., Dexter, E., Irvine, J. M., … & Millet, L. M. (2017). Association between initial opioid prescribing patterns and subsequent long-term use among opioid-naïve patients: a statewide retrospective cohort study. Journal of general internal medicine, 32(1), 21-27.
- Mayo Clinic (2018). How opioid addiction occurs. Retrieved from https://www.mayoclinic.org/diseases-conditions/prescription-drug-abuse/in-depth/how-opioid-addiction-occurs/art-20360372