Anomalies in Swim World Record Times Reveal Years in Which New Tech Was Adopted by The Sport!
World records are broken every so often across racing sports, as training practices improve and techniques are refined. Each time a record is broken it becomes increasingly harder to beat. Often world records stand for many years; however, occasionally we see a substantial increase in the number of world records broken per year associated with the introduction of technology to a sport; as was seen in the 2008 Olympics with the introduction of the LZR racer suit.
It is hypothesized that a large number of world records broken in a short span of time cannot be attributed to human improvement alone, but rather must be attributed to an outside source, such as the introduction of new technology. To test this hypothesis, world record swim time data was curated between the years 1956 and 2017 in six different long course freestyle swim races (i.e. the 50m,100m, 200m, 400m, 800m, and 1500m).
Determining Disruptive Years in World Record Times
Preliminary analysis attempted to determine disruptive years in world record times. As the strength of a world record is determined by the length of time it is held without being broken, the primary goal was to look for years with rapid turnover of world record times. To get at this question, the delta rate of change in world record times (acceleration) was calculated for each of the six events independently, using equations 1 and 2 below.
As world records are generally broken by fractions of a second, the equation is more weighted towards the length of time between world records (with quick world record turn over resulting in a larger acceleration) than the actual magnitude of the difference in world record times. To more easily compare between each event, the data was then normalized to the maximum event acceleration using equation 3.
In an attempt to filter out noise, a cutoff of 50% of maximal acceleration was used to pull out years with substantial increases in acceleration. The lists of disruptive years in each event were then grouped together and sorted to identify the top three most disruptive years: 1967, 1976, and 2008. Plots of this analysis are seen below.
Figure 1 | Acceleration in World Record Time Versus Year. The acceleration data was normalized to the maximum event acceleration. A cutoff of 50% of maximal acceleration was used to pull out years with substantial increases in acceleration (orange dotted line). Plots for males and female times are seen on the left and right, respectively for the 50m,100m, 200m, 400m, 800, 1500m freestyle.
Comparing the years 1967, 1976, and 2008 to the history of swimming, a correspondence is seen to the emergence of three distinct swim technologies. 1967 corresponds to the introduction of timed touch pads to races as opposed to stopwatches; 1976 corresponds to the introduction of swim goggles to the Olympics; and finally 2008 corresponds to the development of the engineered LZR racer full body swimsuits (Ref 1).
A count of the number of world records broken in each year, again reveals an increase in the number of records broken in these disruptive years. Compared to an average of 6.8 world records broken per year, the years 1967, 1976, and 2008 see a total of 19, 22, and 17 world records broken, respectively. Performing a one sided unpaired t-test, these years have a statistically significant increased number of world records broken with a bonferroni corrected p-value of 5.3 X 10⁻¹⁷, 6.8 x 10⁻¹⁹, 4.1 X10⁻¹⁶, respectively. Thus we reject the null hypothesis that the increase in the number of world records broken on these years could have resulted by chance alone.
Modeling Trends in Disruptive Years
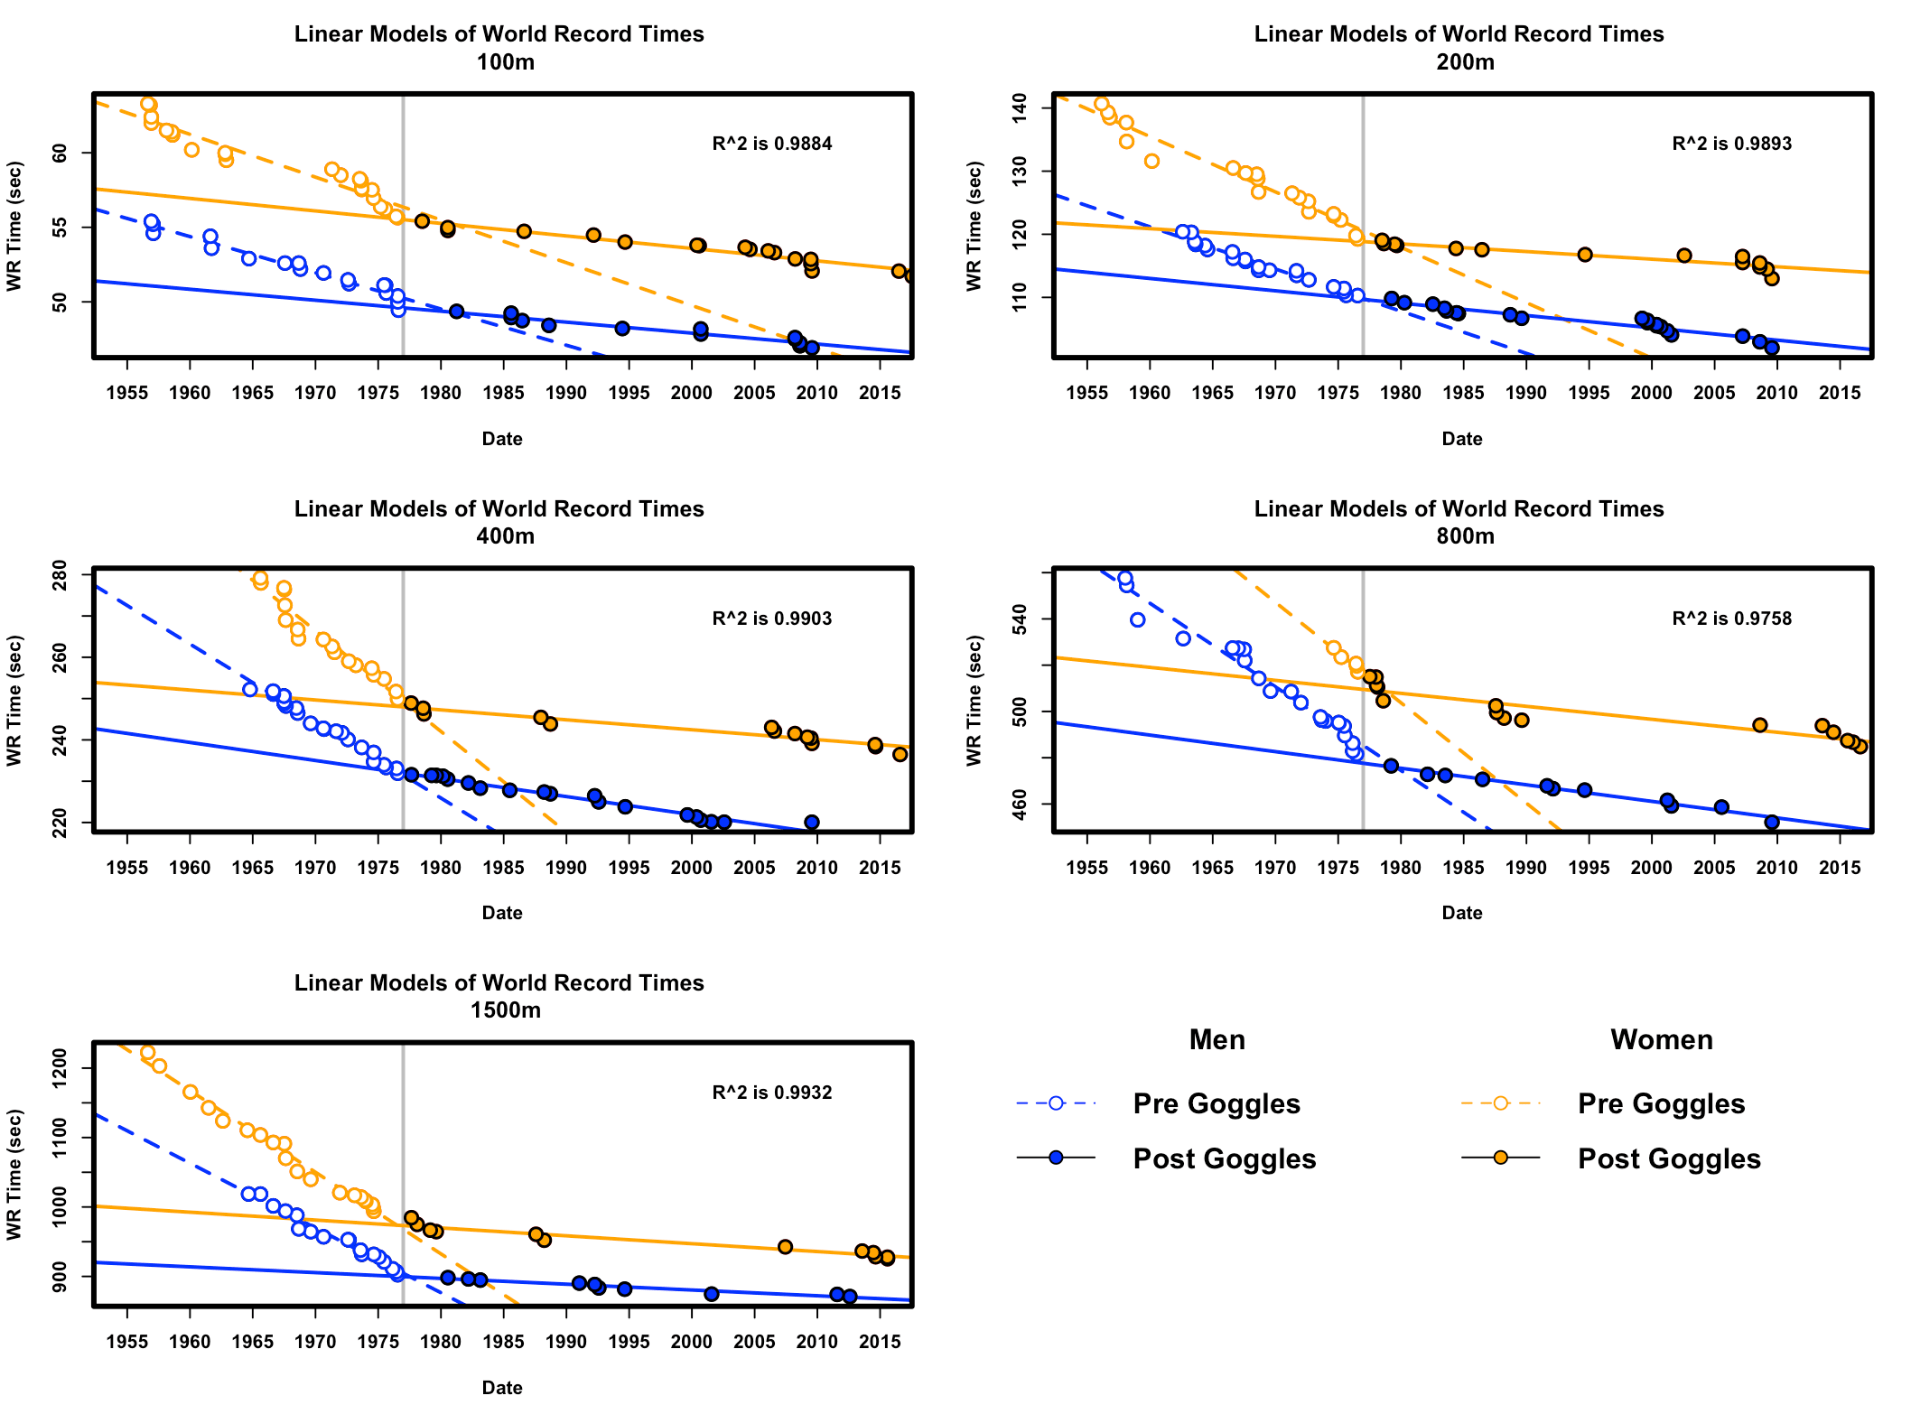
Given that these years were shown to have statistical significance, a question arises of can a noticeable change in record trends be associated with the introduction of the technology? Figure 3 depicts linear models generated for the introduction of goggles to the sport of swimming in the year 1976 for each event. Models for the introduction of touchpads in 1967 and LZR racer suits in 2008 were omitted. As the year, 1967 and 2008 fall at tail ends of the curated data; there was not enough data pre-1967 and post-2008 to generate a linear regression.
Three regression models were developed to assess the relationship in each event, with each model adding complexity to the previous.
Dummy variables were used to develop models to account for difference between male/female athletes and pre/post goggle world record times. Model one accounts for the differences between men and women’s world record times. Model two adds in the differences resulting from the interaction of pre/post goggles and date on world record time. Finally, model three accounts for the differences resulting from the interaction of pre/post goggles, male/female, and date on world record times. The model for each event with the lowest AIC score was selected for analysis to assess the significance of the model’s coefficients.
The models for the 100, 200, 400, 800, and 1500 meter event with the smallest AIC are plotted in Figure 3. The 50 meter race was omitted from this analysis since all data points fall after the year 1976. Across the board, each model produced an R2 value above 0.97, demonstrating that a linear model was well fit to the data. Looking at the groupings before (open circles) versus after the introduction of goggles (closed circles), a notable difference is seen in the trend of world record times. Calculating p-values for each model’s coefficients corroborate this observation, as a statistically significant interaction between the introduction of goggles and date is seen, Table 1. As the β2 value across all events are negative, the regression line is more negative before the introduction of goggles than after. The resulting interpretation is that there is a statistically significant decrease in the rate of world records broken in each event after the introduction of goggles. We can extrapolate this decrease can potentially be attributed to googles allowing for some local minimum to be achieved, where the time to beat became so fast, that breaking the World record became substantially harder.
Conclusions
The exploratory goal of this analysis was three part: (1) to determine disruptive years in world record swim times, (2) to test this significance of these years to world records broken, and (3) to assess the impact this year had on the trend of world record swim data. Primary data manipulation, weighted towards the length of time a world record was held for, generated three disruptive candidate years of 1967, 1976, and 2008; all of which are associated with new technologies introduced to the sport of swimming. Looking at the number of world records in these years, a statistically significant number of world records were broken. Finally, a linear regression model for world record times before and after the introduction of goggles showed a statistically significant change in the trend of world record times associated with that year.
While this data is strictly statistical correlation, the findings imply a potential causational relationship between technologies and swim world record times. It was hypothesized that world records broken in a short span of time cannot be attributed to human improvement alone, but rather must be attributed to an outside source. While a definitive answer to this question cannot be addressed through statistical inference alone, future experiments could be run to attempt to address a causational effect between the use of swim technologies and improved swim times.
Feedback is always appreciated, so please leave comments, ask questions, and feel free to reach out!


Recent Comments