
How is Today’s Climate Change Different from the Past Million Years?
What are Milankovitch Cycles and How Do They Impact Earth’s Climate?
What is Happening Now and What Can We Do?
Earlier this month a paper entitled World Scientists’ Warning of Climate Emergency, with the support of 11,000+ scientist signatories from around the world, was published in Biosciences stating clearly and unequivocally that planet Earth is facing a climate emergency. Undoubtedly something is happening to our Earth, if 11,000+ scientists who have dedicated their lives to studying the climate are saying that we are in a state of emergency. So what exactly is happening?
While I spend my days as a computational biologist studying how temperature affects biological systems at the microscopic, physiological level; this paper highlighted to me that while I believe in anthropogenic (human caused) climate change, my own knowledge for how science explains these changes at the macroscopic, global level is lacking. I decided to formally learn some science and enrolled in an edX course called Climate Change: The Science taught by Professor Sara Harris at the University of British Columbia (UBC). Having made it through a solid chunk of the modules, I decided I wanted to write a blog post summarizing what I have learned, share some interesting data, and maybe even convince a couple people to make some subtle lifestyle changes to push our world in the right direction.
Through this post I will attempt to answer the following questions:
- How Does Our Climate Today Fit into The Context of the Past Million Years?
- How is the Climate Changing Now in Ways That Are Unlike What Happened in the Past Million Years?
- What Can We Do Today to Work Toward Mitigating the Effects of Climate Change in the Future?
This post might be a bit lengthy, so if you don’t manage to make it through to the end — but I honestly think it is worth it if you do — here are some key take aways that are further elaborated with evidence if you continue reading:
- The Earth’s climate naturally experiences changes in temperature over time due to minor changes in the Earth’s orbit.
- These orbital changes are subtle and initiate climate change via amplifying feedback loops that contribute to a 5-6°C temperature change that operate on a time scale of 100,000 years.
- The global warming we see today is exacerbated by amplifying feedback loops related to CO2 concentrations; CO2 concentrations today are at abnormally high levels never seen before in Earth’s history and have nearly doubled in the past 100 years.
- Large-scale, immediate changes need to be made at the individual, societal, and global level to mitigate the effects of climate change.
So without further ado: let’s learn some climate science!
Section 1: Know From Whence You Came
I’ll start the discussion by contemplating the question. How is today’s climate situated in what we know about the past?
The long story short is that Earth’s climate changes over time. If we have learned anything from 90’s nostalgia it is we have two definitive movies as a basis for this concept: Ice Age — a frozen wasteland — and The Land Before Time — a scalding hot planet where dinosaurs roamed. While both are just movies, they are based off of real times in our prehistoric past. There’s evidence for very icy conditions — for example, you might have heard about Snowball Earth — and there’s evidence for quite warm conditions with no ice on the planet at all. So if there have always been extreme heating and cooling events throughout Earth’s history, is this any different from what we are seeing today? To answer this question we’re going to focus our attention mostly on our recent geologic scene — the ice age cycles of the past million years or so — which leads up to our present situation. Let’s start by taking a look at temperature estimates of Earth’s average temperature over the last million years (Figure 1).
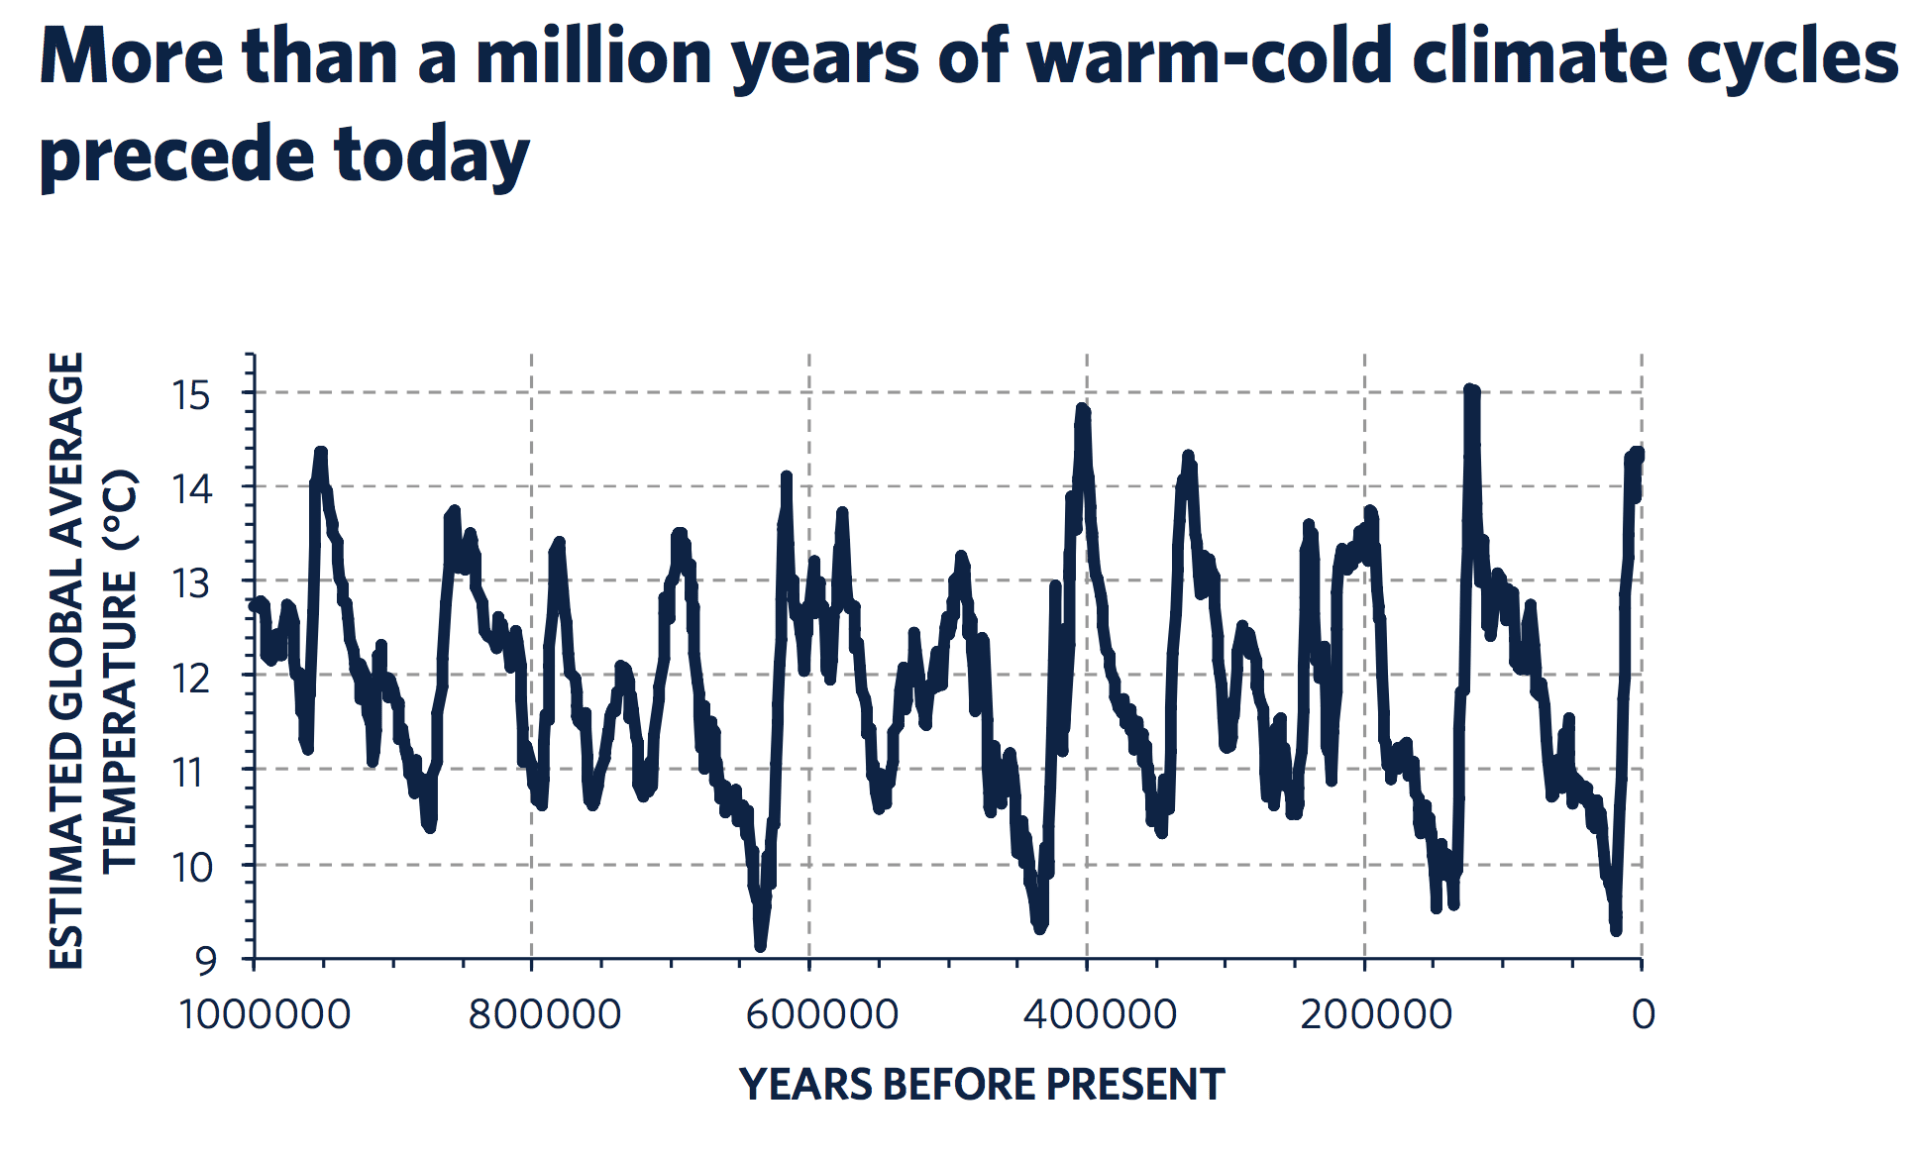
Figure 1 | Earth’s Average Temperature Estimates Over the Last Million Years. Data is measured in degrees celsius as a global average temperature. [ Data from Zachos et al., 2001 adopted from Climate Change: The Science, UCB].
So for example, the most recent ice age, 20,000 years ago — the valley in the data closest to the right — was about 5°C cooler than Earth is today. That doesn’t sound like much, but measurements show that was a time when Canada and parts of northern Europe were completed covered with ice, sea levels were about 120 meters lower than today, and woolly mammoths roamed freely.
Now I know this is climate data and has nothing to do with microbiology, but I wouldn’t be a circadian biologist without noting that this data looks extremely cyclic. We see peaks of extreme warming followed by troughs of extreme cooling. Taking a look at the graph, it seems that this natural cycling between conditions happens about every 100,000 years.
So what causes these changes and why is it so periodic over the last million years?
Milutin Milanković, a Serbian geophysicist and astronomer, developed a model to explain this phenomena in the 1920s. Milanković theorized — in a framework known today as Milankovitch cycles (click for interactive tutorial) — that variations in eccentricity, axial tilt, and precession of the Earth’s orbit resulted in cyclical variation in the solar energy reaching the Earth, and that these orbital changes influenced Earth’s climate patterns (Figure 2).

Figure 2 | Parameters of Earth’s Orbit that Contribute to Milankovitch Cycles. As Earth orbits around the Sun, subtle periodic changes in the Earth’s tilt, eccentricity, and precession produce variation in the solar energy reaching the Earth, influencing Earth’s climate patterns. [Adapted from Climate Change: The Science, UCB].
Let’s break these three orbital parameters down into what each framework actually means.
Eccentricity
It takes about 100,000 years for the Earth’s orbital path to change its shape from nearly circular to its maximum eccentricity, which is a little bit squashed, back to nearly circular again. This cycle can change the total amount of solar energy Earth receives, though just by a small bit as we will see later.
Tilt
It takes about 41,000 years for the tilt of Earth’s axis to go from maximum tilt to minimum tilt and back to maximum. We’re currently at about 23.5 degrees of tilt away from vertical and the tilt’s getting smaller — we’re on our way to standing more upright. The tilt cycle has everything to do with seasonality, and affects how extreme the contrast is between summer and winter conditions. The larger the tilt angle the more contrast we see between seasons in the southern versus northern hemisphere. Take a second to try to picture why this is the case or just check out this link.
Precession
The Earth’s precession, which is probably the hardest one to grasp, can be interpreted as the Earth’s rotational axis drawing out a circle in space, completing one circle approximately every 26,000 years. You can think of the Earth as a spinning top (Figure 3). While the Earth (in this case the top) continues to spin about its axis, it also wobbles around. The angle of the top relative to vertical does not change; however the direction the top points does, tracing a circle. This circular motion, as seen by the wobbling effect, is known as precession.

Figure 3 | A Wobbling Top as an Analogy for Orbital Precession. A wobbling top can be used as an analogy for precession. As the top spins, the angle the top makes with the vertical does not change, but focusing on the peak of the top, we see a circle is traced out.
We saw pretty easily the big 100,000 year cycles in the temperature data. We can analyze the data statistically, and we find that both the 41,000 year tilt cycle and the 26,000 year periodicity associated with precession are also there.
Let’s now look at what this means for the amount of solar radiation Earth receives during this cyclic period (Figure 4). Again, Earth’s relative solar radiation changes on a cycling scale of 100,000 years, similar to the eccentricity cycle. The correlation for eccentricity and levels of solar radiation makes sense, since we would have more solar radiation when we are closer versus farther from the sun.

Figure 4 | Incoming Solar Radiation Measurements Over the Past Million Years. Data is measured in watts per meter squared as measured at the Earth’s surface. [Data from Laskar et al., 1993, adopted from Climate Change: The Science, UCB].
Nonetheless, looking at the y-axis of the above graph, we see that largest change in solar energy is actually pretty small, around 0.5 W/m2 in incoming solar radiation. Based on best estimates, Earth’s Climate Sensitivity — a measure of how much the Earth’s temperature changes per unit change in solar radiation — is ~3/4 °C/(W/m2). This means this change would only account for about 3/8°C [i.e. 3/4 °C/(W/m2) * 1/2 W/m2 = 3/8°C]. That’s not much… If Earth’s climate over the past million years were driven only by these small changes in the total solar energy coming in, we’d see a tiny change in temperature — not the 5-6°C changes that are observed (Figure 1). So what is causing these changes?
What matters more, as we will discuss, are the changes in location on Earth the energy is received, and in which season. Note that the seasons have everything to do with the tilt of Earth’s axis, not Earth’s distance from the sun. If that seems to contradict your mental model of the seasons, remember that when it’s winter in the Northern hemisphere, its Summer in the southern hemisphere, right? If the Earth-sun distance mattered for seasons, we’d all have the same seasons at the same time. Which we don’t.
This is the case today. In early January — which is Southern hemisphere summer– Earth passes through the point on its orbit that is closest to the sun. In early July, we pass through the point that is farthest from the sun. But recall that Earth’s North polar axis doesn’t always point toward polaris, like it does today. About half a precession cycle ago, we had the situation in which the seasonal contrast between the hemispheres was reversed. The Northern hemisphere had slightly warmer summers and cooler winters — higher seasonal contrast than the Southern hemisphere (Figure 4).

Figure 5 | Season Contrasts of the Earth Today Vs. ~11,000 Years Ago Based on Milankovitch Cycles. [TOP] Today, the Earth’s tilt and precession causes high seasonal contrast in the Southern hemisphere, and low season contrast in the Northern hemisphere. [BOTTOM] ~11,000 years ago, the Earth’s tilt and precession caused low seasonal contrast in the Southern hemisphere, and high season contrast in the Northern hemisphere. [Adopted from Climate Change: The Science, UCB].
During the past million years, ice sheets have expanded and contracted primarily on land in the Northern hemisphere. It turns out that low seasonal contrast in the Northern hemisphere is ideal for growing an ice sheet there. The logic is that there would still be snowfall during the warmest winters, but during cooler summers not all the snow would melt away and be built on during the following winter. If a bit extra snow sticks around, and a bit of extra area on our surface is therefore white and reflective, then a little more of the incoming solar radiation would reflect away. Less would be absorbed, and the Earth would cool a little bit, promoting additional growth in the size of the ice sheet. This results in something called the ice-albedo effect and functions as an amplifying feedback loop for climate change (Figure 6).

Figure 6 | The Ice-Albedo Feedback Loop. Low contrast seasonal temperatures in the Northern hemisphere allows for more ice to build up on Earth, covering more surface area. The increase in reflective ice surface, causes more solar energy to be reflected back into space without being absorbed, promotes cooler global temperatures, and effectively repeats the amplifying cycle. [Adopted from Climate Change: The Science, UCB]
Ultimately, the Milankovitch cycles in conjunction with temperature data teach us that it’s the distribution of that incoming solar energy that matters. The distribution is controlled by a combination of tilt, precession, and eccentricity. Small changes in total incoming solar energy (Figure 4), with much larger changes in distribution (Figure 5), combined with feedbacks that magnify those changes (Figure 6), result in the overall change in climate.
But wait… according to the data you have presented we are currently in a period of lower seasonal contrast in the Northern hemisphere, which should be good for the ice-albedo effect and lower global temperatures?! While this is true, there are other feedback loops happening in Earth’s climate. On the opposite end of the cooling feedback loop, there are feedback loops that amplify heating, such as the carbon dioxide (CO2) amplifying loop (Figure 7).

Figure 7 | The Amplifying CO2 Feedback Loop. Initial perturbation of a global temperature increase causes ocean temperatures to increase. Warmed ocean water releases stores of CO2, amplifies the Greenhouse effect, further warms global temperatures, and effectively repeats the amplifying cycle. [Adopted from Climate Change: The Science, UCB]
Let’s revisit the temperature data in light of what we have learned (Figure 8). Again, the blue line represents temperature measurements, while the red line represents atmospheric CO2 measurements from ice cores in Antarctica. These CO2 measurements are a good representation of global atmospheric CO2, since the atmosphere mixes quickly and thus there aren’t big differences at different locations on these time scales. Looking at the global temperature estimates and the atmospheric CO2 measurements it is clear the two records are correlated. High concentrations of CO2 occur with warm global temperatures. Low concentrations of CO2 occurred with cool global temperatures.
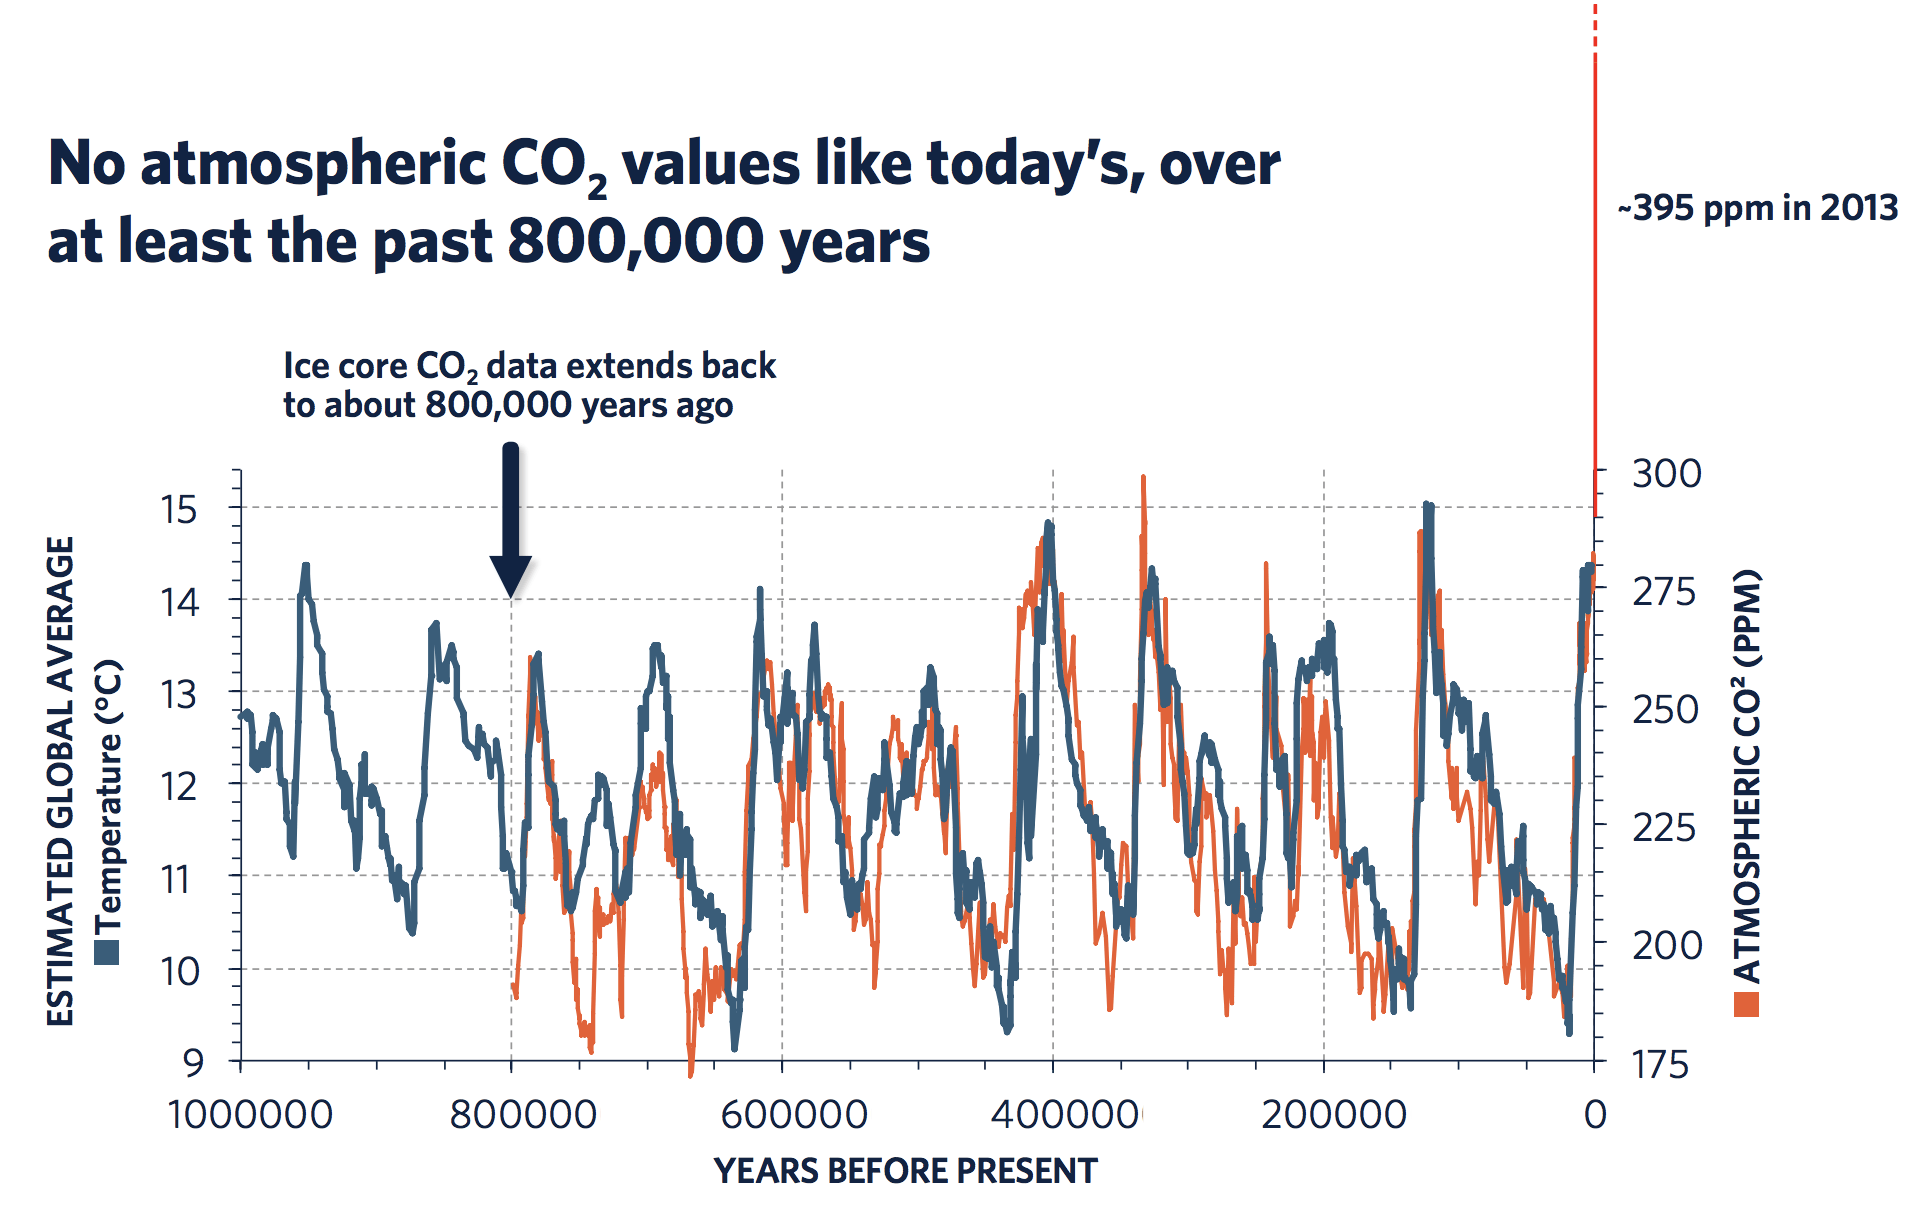
Figure 8 | Estimates of Global Temperatures and Carbon Dioxide Measures Over the Past Million Years. Temperature estimates over the last million years are in blue. Atmospheric CO2 concentration over the last 800,000 years are in orange, corresponding to earliest data estimates from ice cores in the Arctic. [Adopted from Climate Change: The Science, UCB]
Let’s now think about these two combining together in a feedback. Imagine that something happens to change the distribution of incoming solar radiation to make Earth’s temperature increase a little, warming the ocean. The oceans which hold dissolved CO2 gas, will slowly release CO2, as less gas can be dissolved in solution at warmer temperatures. More CO2 in the atmosphere means that the strength of the greenhouse effect goes up, which promotes further warming, which promotes further out gassing of CO2 from the oceans, etc… In this example, the perturbation is towards warming; you can imagine however this feedback loop starting with a perturbation that makes global temperatures get a little colder. Same processes, just in reverse, but still an amplifying feedback.
So this is our geologic backdrop. During the past million years, Earth’s climate has cycled between warm and cold periods with the cold periods about 5-6°C colder than the warm periods. These cycles happen regularly at periodicities that match the periodicities of the cyclic changes in Earth’s orbit around the sun. Atmospheric CO2 (the red curve) is directly correlated with these changing temperature cycles, and over the past million years, has cycled up and down from highs of about 280 parts per million (ppm) to lows of about 180 ppm.
So what have we learned? Ultimately, it’s not changes in the total amount of energy Earth receives that matter so much for these climate cycles of the past million years, but rather how the solar energy is distributed over the globe and how that translates into seasonal contrast. Also crucially important are feedbacks happening here on Earth, which amplify the subtle pushes given by the orbital changes. In particular, the ice-albedo feedback amplifies warm and cold extremes through the melting or growth of ice sheets. And feedbacks between CO2 and temperature do the same, amplifying global temperature changes in the direction of the initial perturbation.
Today, atmospheric CO2 is close to 400 ppm and rising. Notice that at no time in the past 800,000 years, has Earth’s atmospheric CO2 concentration been anywhere near as high as today (Figure 8). The value today is highly unusual and the rate of change is highly unusual compared to our geologic context. For further comparison, the approximately 80-ppm rise in CO2 concentration at the end of the past ice ages generally took over 5,000 years. In contrast, the over 120-ppm rise in CO2 concentration we see today, has taken place over the past century (IPCC Fourth Assessment Report: Climate Change 2007)
Evidence has stacked up that these abnormalities have not been seen in our planet’s past. The data similarly indicates that the global warming of around 5°C at the end of an ice age was a gradual process taking about 5,000 years (IPCC Fourth Assessment Report: Climate Change 2007). Further back in time, beyond ice core data, the time resolution of sediment cores and other archives does not resolve changes as rapid as the present warming. Although large climate changes have occurred in the past, there is no evidence that these took place at a faster rate than present warming. If projections of approximately 5°C warming in this century (the upper end of the range) are realized, then the Earth will have experienced about the same amount of global mean warming as it did at the end of the last ice age. Ultimately there is no evidence that this rate of possible future global change was matched by any comparable global temperature increase of the last 50 million years (IPCC Fourth Assessment Report: Climate Change 2007)!
So why did I spend so much time attempting to understand our geological backdrop and the natural processes of Milankovitch cycles and their impact on Earth’s Climate? Essentially, I wanted to make the point that there has always been evidence of global heating and cooling, a primary argument made by those who deny anthropogenic (human made) climate change; however, the recent abnormalities in the rate of change in measures of CO2 concentration and temperature have never been seen before in our planet’s history. These abnormalities do however correlate directly with the start of the industrial revolution (IPCC Fourth Assessment Report: Climate Change 2007).
Section 2: If You Know Whence You Came, There Are Absolutely No Limitations To Where You Can Go.
Now that we have a better grasp of how the climate system functions, I want to revisit the article I mentioned as the spark for the creation of this post: World Scientists’ Warning of Climate Emergency. Reading though this paper, it is clear that we have reached a state of climate emergency. So what can we do? The article highlights six sectors for major change: Energy, Short-Lived Pollutants, Nature, Food, Economy, and Population. It should be noted however, that this list is in no way exhaustive.
In short, the authors state that swift political action is necessary to end subsidies for fossil fuels and to instead provide subsidies that incentivize the use of low-carbon renewables. Wealthy nations must also aid poorer nations in adopting more sustainable solutions in the energy sector. This reduction would tie in with efforts to reduce production of shorter-lived pollutants such as methane and soot, whose action disproportionately contributes to climate change and other environmental degradation through climate feedback loops. Economic paradigm shifts must be made toward the development of carbon-free economies changing focus from a growth mindset to that of preservation and a decreased dependence on the biosphere, effectively promoting proforestation and other restoration efforts. In doing so our food consumption must shift from excessive eating of animal products to mostly plant-based foods. Finally, the world population must be stabilized, and ideally reduced, in a way that ensures social integrity: making family-planning available to all people, removing barriers to their access, achieving full gender equity, and including primary and secondary education as a global norm for all, especially girls and young women. If you are interested in learning more and exploring models for how these changes can impact global warming, check out project DrawDown: The Most Comprehensive Plan Ever Proposed to Reverse Global Warming.
While the last paragraph was kind of intense and seems overly daunting, there are still ways we can impact climate change more directly. As individuals we can begin making subtle changes in our lives and working to push society in the right direction. Even just choosing to adopt one of the following suggestions can go a long way if enough of us partake.
- Consider taking public transit more regularly or try biking to work more often! It’s great exercise!
- Take a mindset that everything you need is already out there! Buy your clothes in thrift stores, it’s more fun and you’ll look sick!
- While you might not be ready to become a vegan just yet, maybe take the step to cut beef from your diet. Try the new impossible burger, only eat meat out, or try cutting back to eating meat a couple times a month!
- Send a letter, call, and pressure your local politicians to make climate change a bigger issue on their agenda!
- Get out on the streets and build awareness by marching to end climate change!
- Get educated and educate others, because with great knowledge comes great responsibility for our climate’s future!
Have other ideas? Feel free to leave them in the comments below!
Closing Remarks
So there you have it! Hopefully you made it to this point and are slightly more informed than you were coming into this post. Climate change is a huge issue and a daunting task, but the better informed we are the better equipped we are to mitigate its effects. So keep learning, share this post and info with others, and keep fighting the good fight!
Did this blog post spark your interest? Want to learn more?! Check out the UBC edX course Climate Change: The Science and consider spending some of your time each day learning about how our climate functions and how it might change. Or maybe do your own data exploration using NASA’s planets vital.
Feedback is always appreciated, so please leave comments, ask questions, and feel free to reach out!
WOW thank you:)
this was really interesting to read and I learned a lot.
loved all the links.
I’m adding a link to an interesting website that calculates roughly your ecological footprint. It’s nice to play with.
https://www.footprintcalculator.org/