by Tom Ogorzalek, Kumar Ramanathan, and Jacob Wu
In November 2020, the Presidential election took most of the headline space in Illinois and elsewhere. Down the ballot, however, important choices were made in many states and cities that will both impact Americans’ lives. Some of these results can also help us learn about voters’ priorities and ideological decision-making. In Illinois, the recent statewide ballot measure to amend the Illinois constitution is a theoretical headscratcher: “Why would an electorate reject a tax that only applies to the richest 3%?”
The Fair Tax Fails
Here in Illinois, there was a major ballot initiative under consideration that had a surprising result. Labeled the “Fair Tax” by its proponents, it would have allowed for a progressive income tax in the state. More precisely, the measure would have enabled the state legislature to change the state income tax from a flat tax to a “bracket” structure tax different levels of income at different rates, something currently forbidden by the state constitution. The measure was tied to a specific proposal in the state assembly that would have slightly increased taxes on household incomes over $250,000 while slightly reducing tax rates on incomes below that level, essentially shifting some tax burden to the rich.
As described in detail by Ballotpedia here, proponents of the measure, most notably Governor Pritzker and progressive labor movement organizations, saw it as a way to restructure one stream of revenue for the state by shifting some burden to the highest-income Illinoisans (most states have a progressive income tax structure, though some have no income tax at all). Opponents, most notably hedge fund mogul Ken Griffin and the state Republican Party, characterized the measure as a slippery-slope power grab by an untrustworthy legislature (Illinois faces deep, chronic debt problems, despite its balanced-budget constitutional requirements), and a sort of gateway to overall higher tax rates, which might lead to an exodus by businesses and wealthy individuals. We wrote previously about some of the background to the measure here.
We’ll put the judgments about policy aside for a moment, and focus on political expectations and surprises. Most theories of voter self-interest would suggest a tax on the top 3 percent would be quite popular. Indeed, in the run-up to November, most polls suggested that the measure would get the supermajority of votes it needed to succeed. In the event, however, it failed to achieve even 50 percent of the vote. The result will likely be the continuation of the flat tax, and therefore a modest tax increase for all Illinoisans in order to balance the budget as required, rather than a more targeted increase on the top 3 percent of earners.
Voting Against Our Interest?
This outcome presents a new observation in the now decades-long tradition of political scientists asking “What’s the Matter” with various states. Typically, as in the case of Frank’s “What’s the Matter With Kansas?” and Gelman et al’s reply in “What’s the Matter With Connecticut?” these analyses use partisan choices that appear to cut against a group’s perceived class interest. The underlying assumption is an old one in democracy, which suggests that for “rational” voters, political choices will often depend on pocketbook calculations based on one’s place in the income distribution. Frank asks why so many working class Kansans support a Republican party of upward redistribution, and Gelman et al ask why relatively affluent Connecticutians (is that how you spell it?) are mostly Democrats, supporting redistribution. This kind of “mismatch” is spotted in many circumstances in the U.S.
In the U.S., of course, one powerful explainer is the messiness of partisan politics. Voting for a president or governor involves making a weighted choice on a wide range of economic, cultural, identity, and governance issues all at once, and it’s increasingly obvious that American politics isn’t all about where one lies in an objective national class structure or selfish, accurate, pocketbook calculation of redistributive scheme. In the Fair Tax, however, the issue of redistributive taxation is cleaved off from the others, allowing for a bit more clarity. The Fair Tax proposal under consideration would have had a cost to about 3 percent of Illinois households, while marginally benefiting the other 97 percent. Thus if voters made their choice based on a narrow “pocketbook” calculation, we’d expect it to pass by about 97 percent to 3 percent! In the end, it received about 47 percent support. So where did that “missing” 50 percent of support for the measure go?
Breaking down the results
What can we learn from this case? We took a quick look at the aggregate results data from November to see what structured the vote. As a first step, it’s helpful to know that Illinois’s high-income households are overwhelmingly and disproportionately located in the Chicago metropolitan area. In this table, we count households with annual incomes above $200,000 as “rich”, because the Census doesn’t have a break at $250k like the bill did:
| Total Households | Total Rich Households | % Rich | |
| Illinois | 4,849,000 | 402,000 | 8.3 |
| Chicago Metro Counties (IL) | 2,961,000 | 314,000 | 10.6 |
| Cook County | 1,972,000 | 185,00 | 9.4 |
Source: US Census
Readers can take two things away from this table: non-metropolitan high earners are pretty rare (about 90,000 of them spread across 95 counties), but within the metro area, they aren’t that common either—about 1 in 10. Very high income households can’t be too common, or we wouldn’t call them one percenters! The first one shows the county-level support for Biden in 2020. The second uses the same color scheme, but resizes the counties according to total population, so you can see how a state with so much “red space” is so reliably blue in elections. The third map resizes the state’s counties based on the number of high-income households they have, and colors it by the percent of high-income households. (Note in this map, the high-income threshold is $150k, so the percentages are about twice as high as in the previous table, and much higher than the number who would be hit by the tax, though the relative positions are very similar.)

Most downstate counties have very few high earners, both because they have fewer people and because average incomes are lower there. Given these dynamics, and the particular tax reform proposal paired with the constitutional amendment, we might expect very high levels of support for this measure across the state, especially in places where there are few households with high salaries. The proposed progressive structure would effectively allow a direct fiscal transfer not only from richer to poorer households, but also–because all the high-income households are upstate–a transfer of resources from the Chicago metro to downstate counties (both in absolute terms and relative to the status quo).
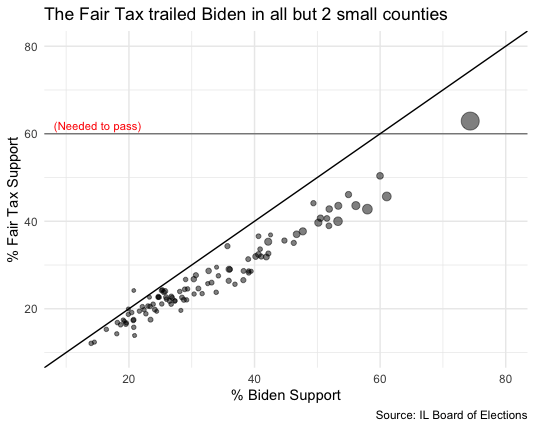
That expected voting pattern did not materialize. Support for the tax was related to local income level, but in the opposite direction one might expect–richer places were actually far more supportive than poorer areas. County-level support for the bill was more strongly related to partisanship. As the scatterplot shows, the Fair Tax did better in counties where Biden did better. But Biden also received more votes than the Fair Tax measure in 100 out of 102 counties in the state. This observation is unexpected given the recurrent finding that redistributive measures are quite popular among a wide range of groups in the electorate–even Republicans. Given that the measure needed a supermajority support for quickest passage, the results are even more surprising: in only 1 county (Cook), did the Fair Tax receive that level of support.
Aggregate data like these county-level outcomes are always subject to the ecological inference problem, so it’s helpful to look closer to understand more. Unfortunately there aren’t a lot of polls available on this measure, and those that we do have suggest much higher support for the measure than happened in the election, so they may not be as valuable anymore. Within Cook County (the second most populous county in the country, with about 5 million residents, and home to about half of rich Illinoisans), though, we can use smaller levels of geography to learn a little more about the patterns in support. While these figures still rely on aggregate data (so we can’t tell exactly how different kinds of people are voting within these tracts), residential segregation levels are pretty stark within Cook County, so there really are areas composed primarily of very high- and low-income households, mitigating some of the concerns we have about aggregate data.
What doesn’t vary quite as much in Cook County as it does across the state is party allegiance: most areas of both Chicago and its closest suburbs are overwhelmingly Democratic. This helped make Illinois a “safe” state for Biden—he won big margins in Cook and metro Chicago overall—but it didn’t carry over onto the redistributive tax measure farther down the ballot. The lines in these figures depict the average support for Biden and the Fair Tax in Cook County precincts at different levels of income (here, the percent of households in a precinct with incomes over $150,000).
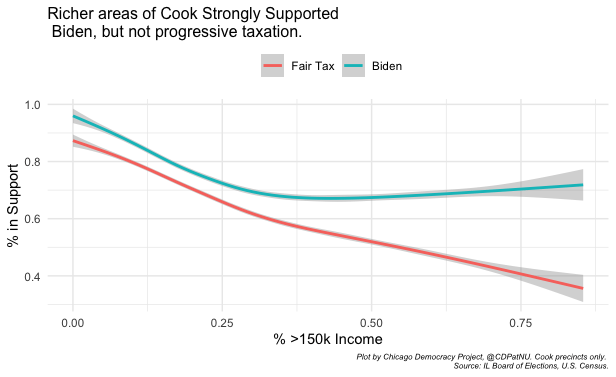
While support for Biden in Cook County was very high (on average) at all income levels, the Fair Tax was much less popular in high-income areas, where the measure trailed Biden by more than 40 points on average. This relationship is basically what we’d expect from pocketbook voters, though we might expect a steeper slope and higher levels of support overall.
What does this mean?
Why don’t even Democratic electorates raise taxes on the rich? This is just one result in one state, but it carries useful information for understanding the contemporary partisan coalitions. A study of a similar measure on the ballot in Washington suggests that the IL Republican message of “not trusting the IL state government with this tax change” may have been successful. These patterns also suggest that the recent shift among wealthy, high-educated white suburbanites to the Democratic party may be more about partisanship than issues: many affluent suburban areas are increasingly repelled by the politics of antagonism, resentment, and crude white supremacy represented by the 45th president and the new GOP, but they may not be committed to an actively progressive policy agenda. We saw a similar pattern on the “second-dimension” issue of criminal justice reform in the State’s Attorney race in Cook County. Conversely, while hypothetical redistributive policies poll consistently well among rank-and-file Republicans, these voters may follow partisan cues even when policies are separated from office-holder contests on the ballot. This suggests a complicated field of play for those campaigning to alleviate inequality or policymakers managing state budgets.
You must be logged in to post a comment.