

Experimenting with Shiny for Python
Posted April 12, 2023
Shiny is a free, open-source, low-code utility for creating interactive figures that can be deployed to a website. R coders have been using Shiny...
Posted April 12, 2023
Shiny is a free, open-source, low-code utility for creating interactive figures that can be deployed to a website. R coders have been using Shiny...
Posted January 9, 2023
As datasets become larger and more complex, exploring and extracting information from them has become commensurately more difficult. Yet large and complex data sets...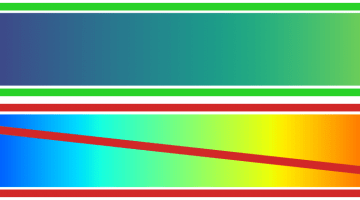
Posted May 20, 2022
The choice of color(s) has a strong impact on the message that is conveyed in a scientific figure. It is therefore extremely important to...
Posted March 30, 2022
This is a companion to my previous blog post, where I compared popular Python libraries for creating interactive figures. Here I will use...
Posted February 3, 2022
I love using, creating and teaching people about interactive figures. They can be incredibly useful tools for investigating your data and for sharing your...
Posted January 4, 2022
Last month I wrote a blog post diving into the nitty gritty details about how to download a satellite image as a GeoTIFF file...
Posted November 19, 2021
Recently I went looking online for a satellite image of Chicago to use in an RCS workshop. I figured that a simple Google search...