As datasets become larger and more complex, exploring and extracting information from them has become commensurately more difficult. Yet large and complex data sets are often ripe for serendipitous scientific discovery via visualization. Firefly, an innovative data visualization application that Alex Gurvich and I developed, enables interactive exploration of very large multi-dimensional datasets directly in a web browser or with Python.
For example, Firefly can easily visualize the billions of stars in our galaxy mapped by the ESA’s Gaia satellite. In addition to precise positions and velocities for each star, the most recent data set (“DR3”) from the project also contains many other attributes and can be linked to other existing astronomical surveys. A dataset like this with billions of rows (and dozens of columns) cannot be visualized with traditional tools such as Python’s matplotlib or R’s ggplot, and specialized visualization programs can be difficult or expensive to use. Furthermore many existing tools have very specific use cases and data format requirements, while Firefly offers broader accessibility; if a dataset has at least three dimensions (typically spatial, though that is not a requirement), it can be visualized and examined with Firefly.
In astrophysics, we typically call 3D datasets (whether from simulations or observations) “particle data”. Beyond simply plotting the locations of the particles, Firefly allows users to “fly” through a 3D dataset, e.g., of particle positions, and visualize any other attributes of the particles through color, size, and/or vectors This allows users to identify regions of interest for further analysis later, something that Firefly makes easy through integration with Python.
Similarly rich datasets exist, or will soon exist, in nearly every scientific field. Astrophysics is ripe with such datasets, and huge particle datasets are also continually produced from geophysics (e.g., LIDAR and other mapping and photogrammetry surveys), material science, particle physics, and also from 3D assets for games and movies, to name a few examples.
Firefly at a Glance
Firefly is an open-source web application that allows users to interactively explore and share 3D particle data. Within a Firefly instance, users can fly around their data using two different control options, one that has a fixed center and allows the user to zoom in/out and “orbit” around a point, and a second that enables the user to freely fly throughout the data. The data is rendered as points in space, and users can change point colors and sizes, filter the data by different attributes, visualize vector field data as arrows (or lines or triangles) instead of points, and make many more customizations—all in real time. Users can also export images and movies of their visualizations.
Users can explore their data using Firefly either within a browser and or as part of a Python workflow within a Jupyter notebook. Once a Firefly visualization is created, the interactive visualization can be shared with others by sending data and settings files to other Firefly users. Alternatively, it is simple to share the data and files through a website hosting service like GitHub pages and share Firefly fully interactive visualizations with others by sending them a URL. Anyone can then view and interact with the visualization in their web browser without the need to install any additional software.
At its core, Firefly is a Javascript app that uses WebGL to efficiently render millions of particles simultaneously in an interactive scene, using the three.js library. The app includes an expansive user interface which can be customized using a configuration file, allowing users to create visualizations for different audiences and use cases without changing the underlying code or data.

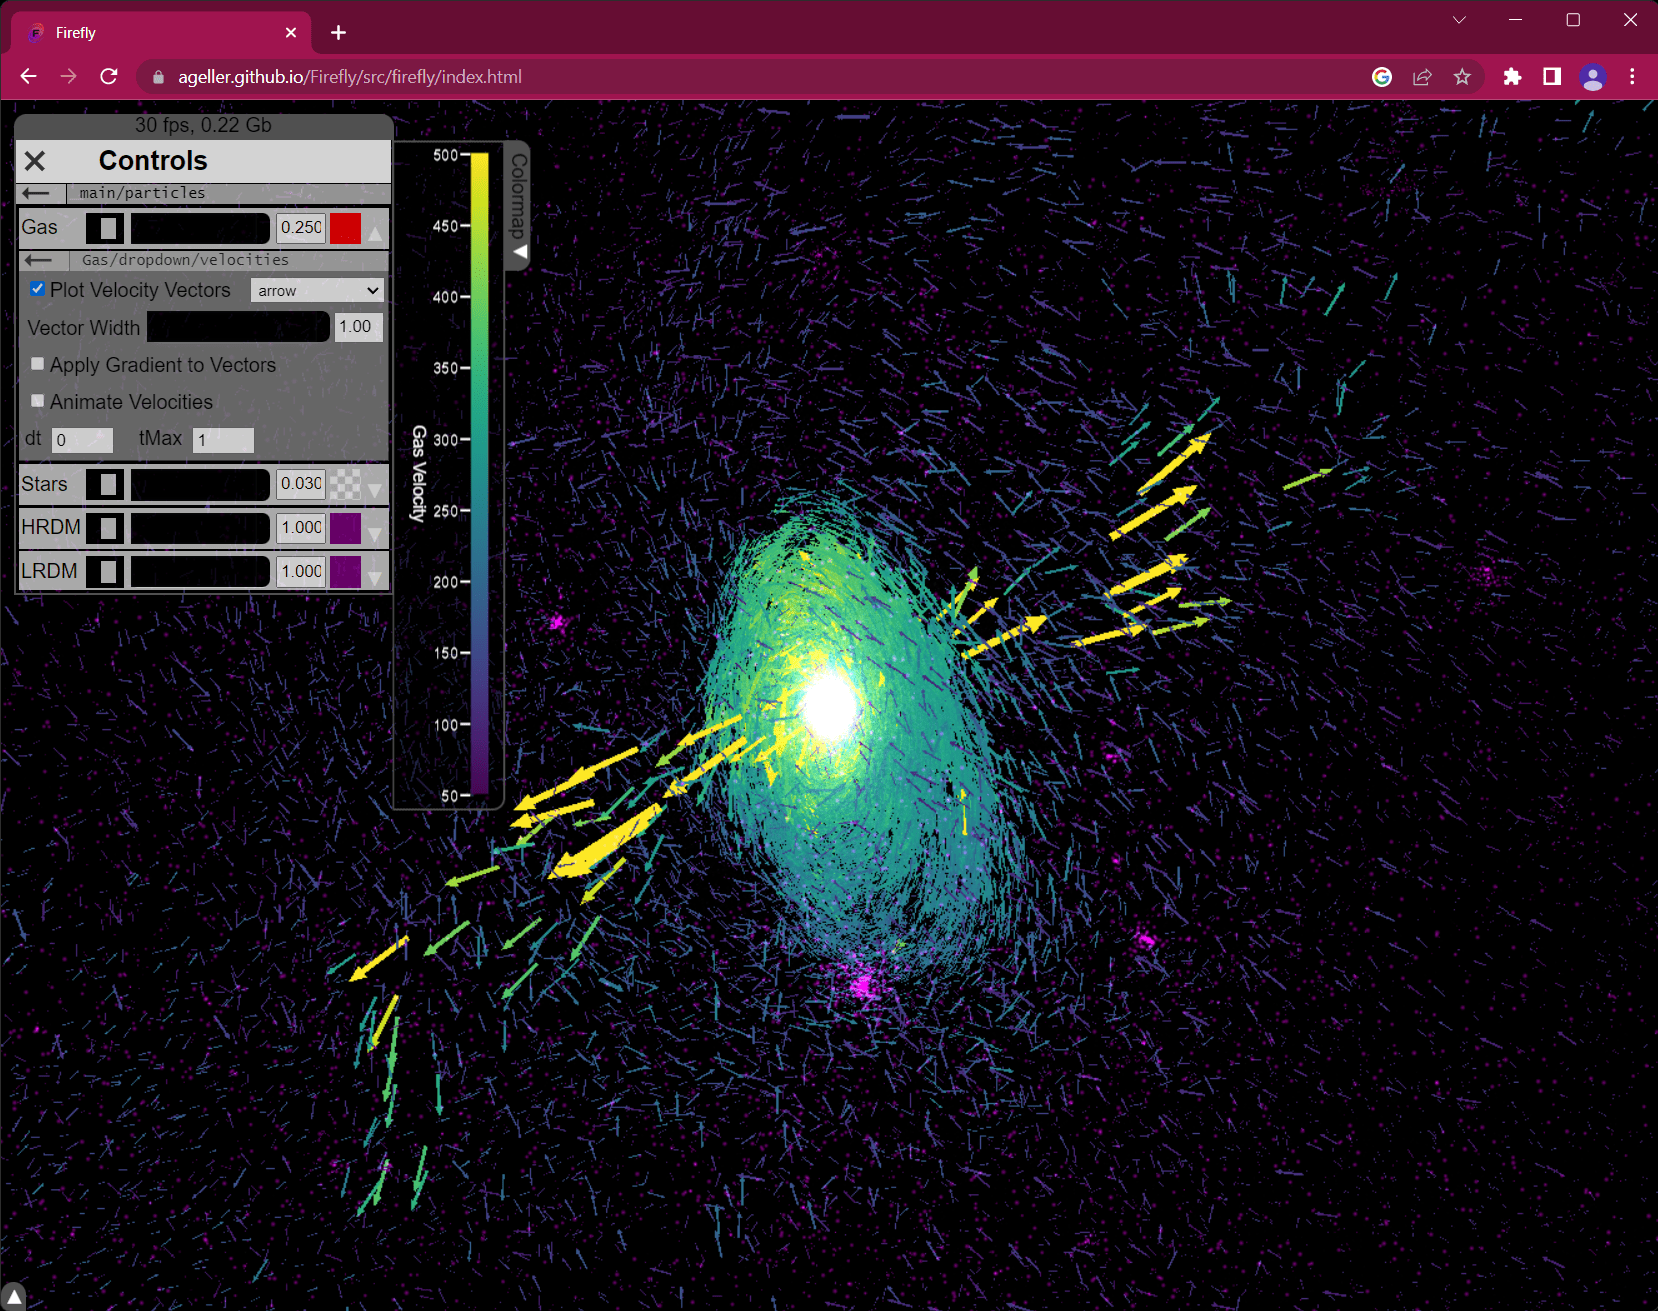
An example of a Firefly visualization of a galaxy formation simulation dataset, available to interactively explore here. The data rendered as arrows corresponds to the velocity of different gas fluid elements from the simulation. The color and size of each arrow are scaled such that fast-moving hot gas is yellow and large while slow-moving cold gas is blue/purple and small. This combination emphasizes the biconical outflows driven from the galaxy’s center. The user interface is shown in the upper-left corner and displays a sample of controls for the particle data. (Additional controls are available but not shown here.)
Using Firefly with Python
In addition to its core visualization functionality, Firefly also includes a Python front-end that allows users to generate their own Firefly visualizations and host virtual web servers on their local computers using Python’s Flask library. Using Flask also enables users to control their visualization via a remote device (i.e., a tablet, see documentation), livestream the output of their visualization from a remote server (like Quest, see documentation), or load new data into Firefly directly from Python (see documentation).
Importantly, loading data into Firefly directly from Python enables users to incorporate Firefly into existing workflows, especially those that require interactively visualizing, exploring, and then analyzing large multi-dimensional datasets. Because Firefly is built as a webpage, it can also easily be displayed with full functionality in a Jupyter notebook using an iframe, allowing Firefly visualizations to be incorporated with other data analysis and visualization code written in Python or other languages. Firefly’s Python front-end allows a user to send data directly from a Jupyter notebook (e.g., data stored in a numpy array) to a local instance of Firefly (within the same notebook or in a separate browser). Documentation on this workflow can be found on our docs site here.
Firefly’s Octree Rendering Engine: Pushing to Billions of Particles
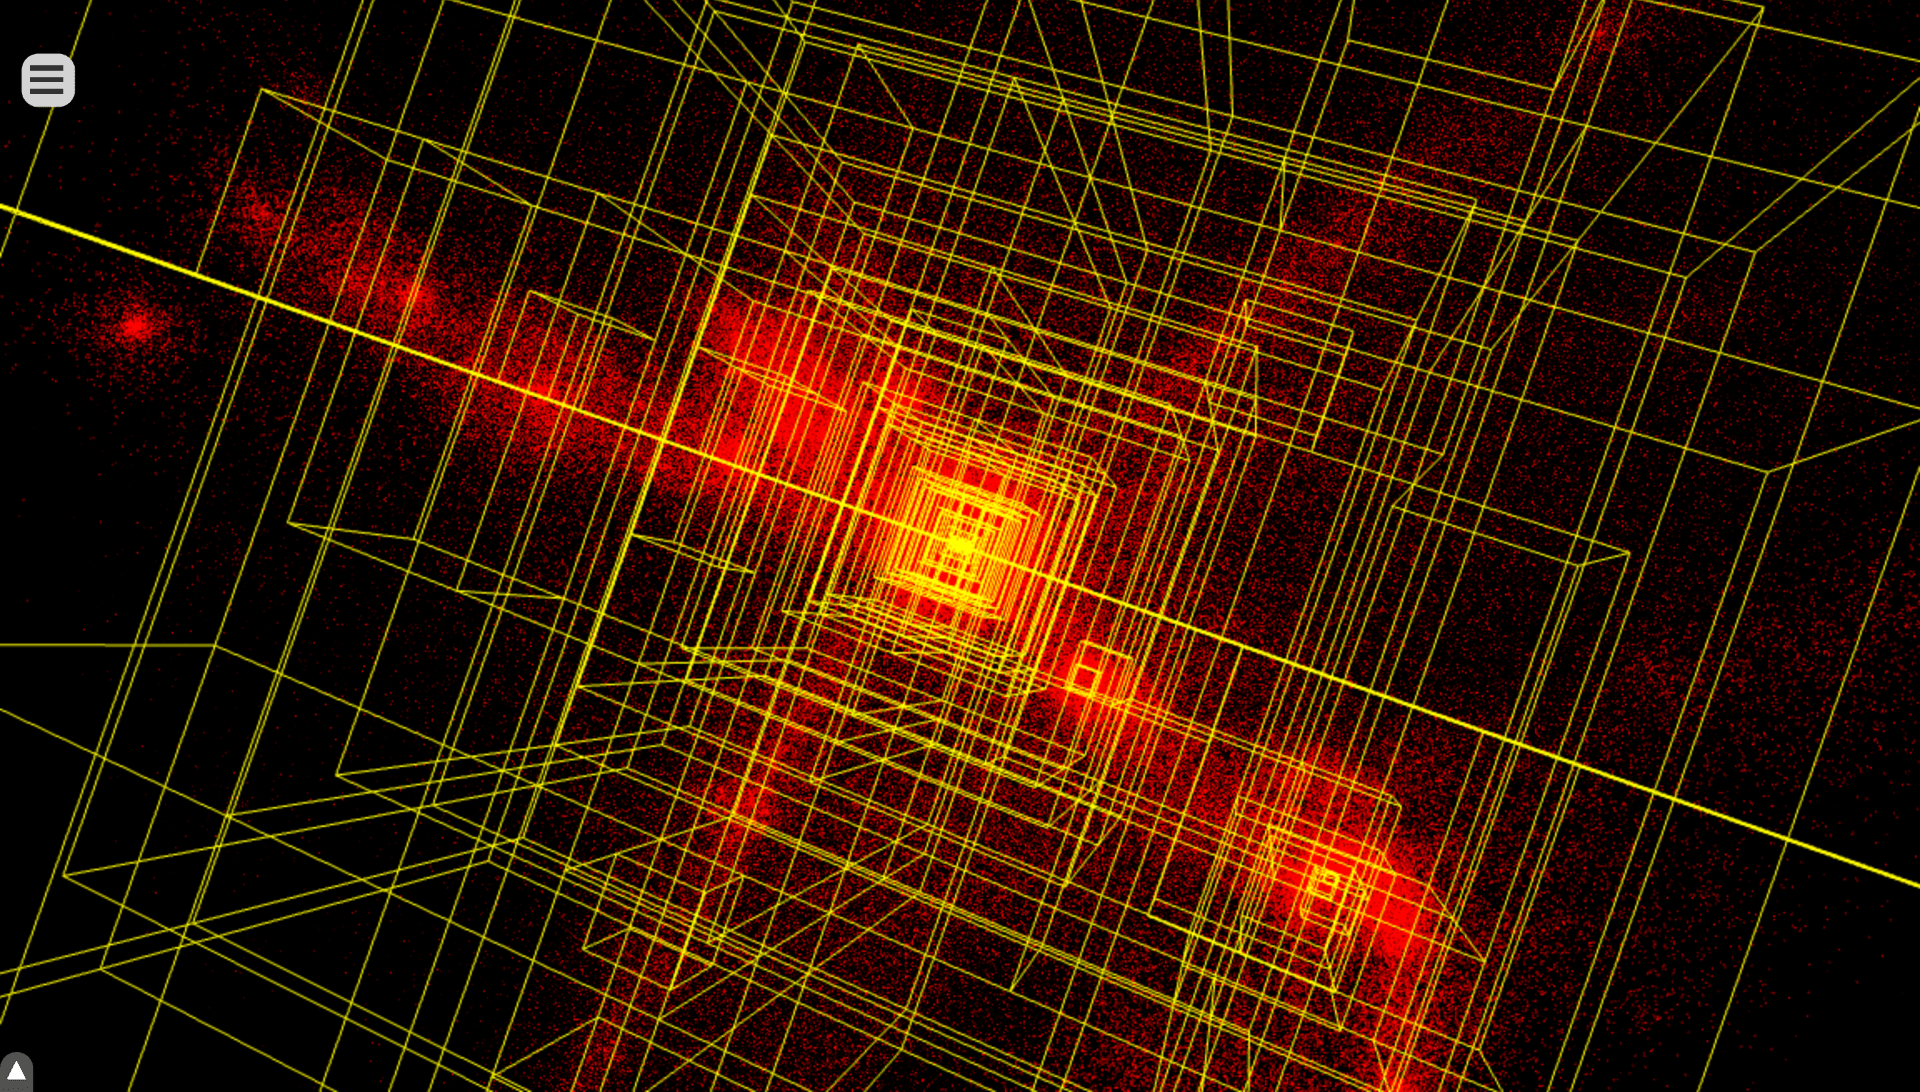
Firefly has two different rendering modes: (i) a “normal” mode that loads and renders all particles within the dataset when the webpage initially loads, and (ii) an “octree” mode that progressively loads particles during data exploration based on their distance from the camera. The normal rendering mode can accommodate millions of particles on a typical computer. The octree mode can in principle handle any size dataset and will only show the particles that are nearest to the camera and up to the memory limitations of the user’s computer and browser. As an illustrative example, the image below shows Firefly using the octree mode for a large data set with the optionally displayed partitioning boxes shown in yellow.

An example of Firefly in the octree rendering mode. Yellow boxes outline each of the nodes which partition the data into 10,000 particle chunks. Each particle is shown here in monochrome red. Only those nodes which intersect the camera view are loaded and drawn. The boxes are disabled by default and usually only enabled for debugging purposes.
On Firefly’s gallery page, we provide an example of Firefly’s octree rendering engine in action using Gaia’s full DR3 data set of 1.46 billion stars. In this example, the user begins at the location of Earth looking out at all the stars in our galaxy (represented as circles). Data is progressively loaded over time to fill in the volume. Users have all of the usual Firefly controls over how and what data are displayed via the user interface.
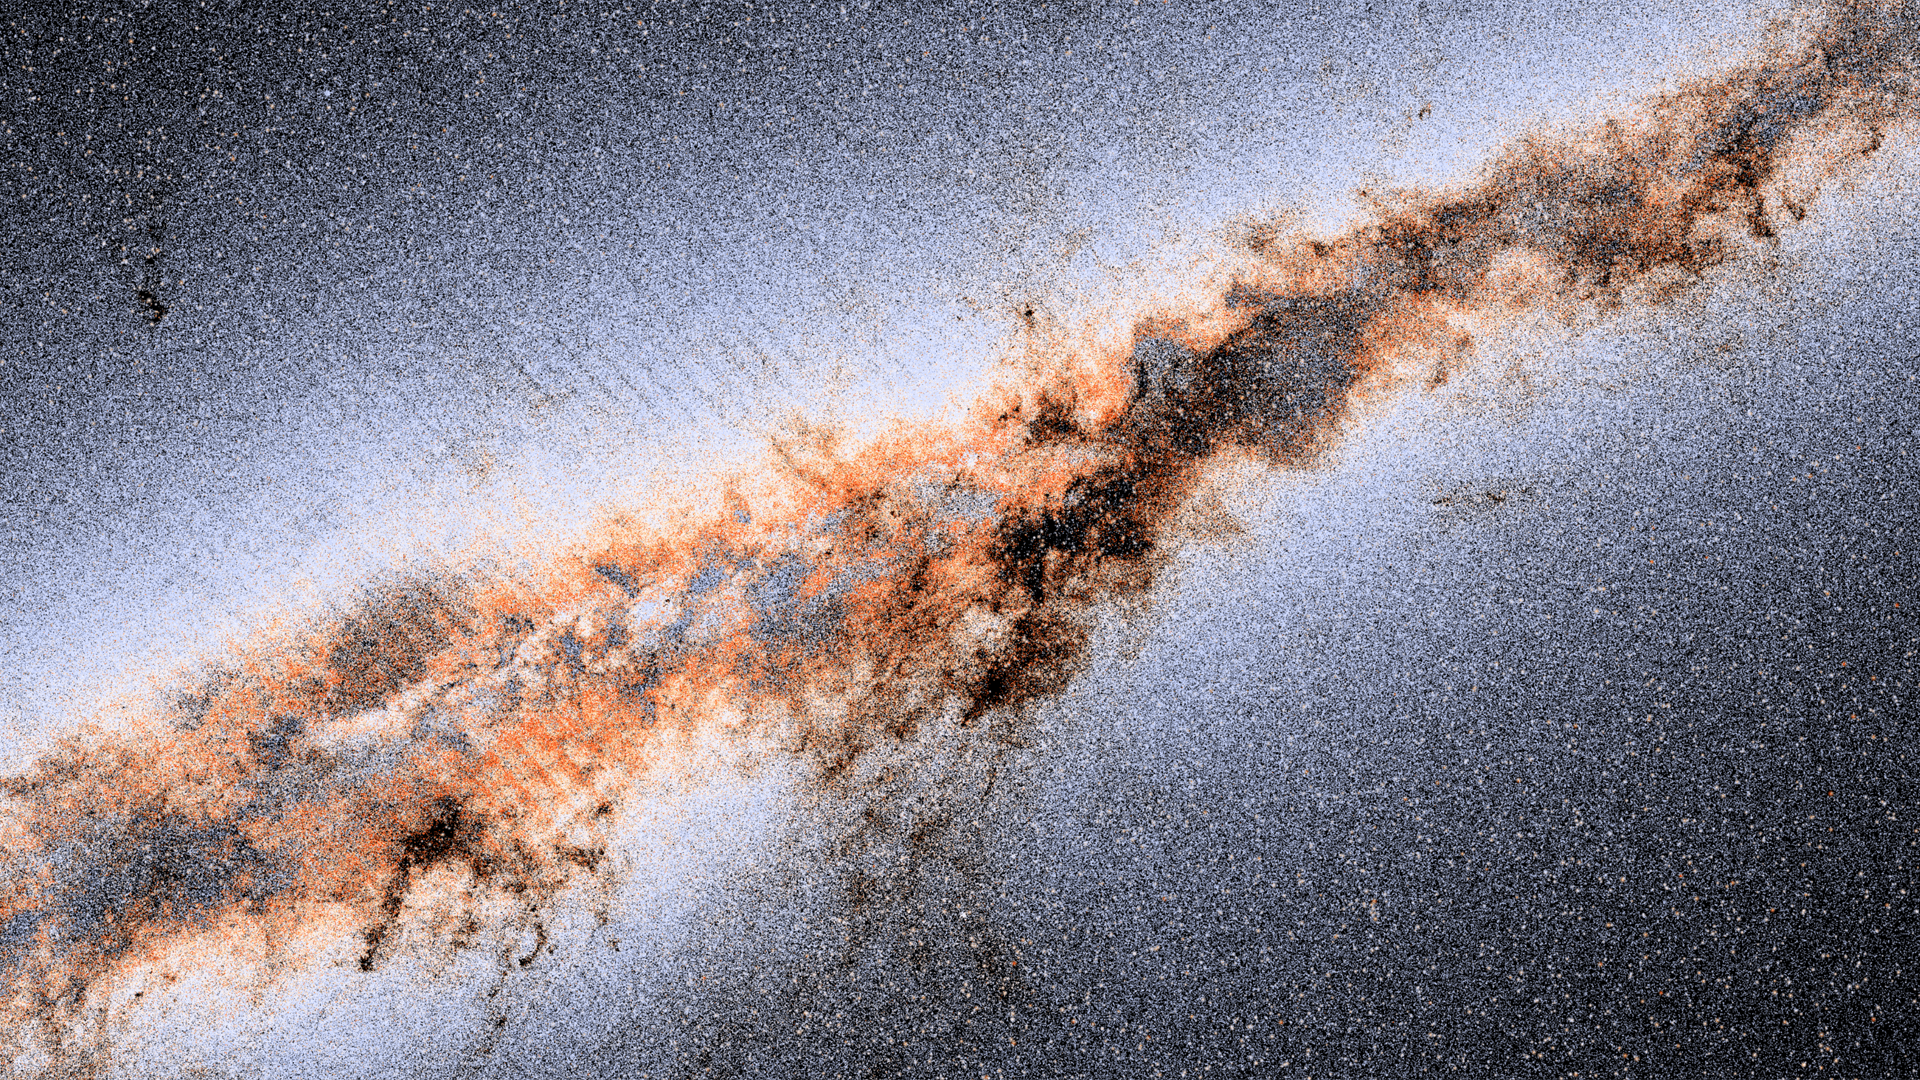
The image from Firefly shown below resembles photographs of our Milky Way, where dust lanes within the galactic plane obscure light from more distant stars. But Firefly renders the scene as a 3D landscape that can be explored in real time. To my knowledge, Firefly is the only tool that allows a user to visualize and explore all of the Gaia DR3 data interactively.

An image exported from a Firefly visualization of Gaia DR3 data, available to interactively explore here. This image includes all of the stars with radial-velocity data in this region of the sky and shows the dark band of our Milky Way galaxy, where dust in the galactic plane obscures Gaia’s view of the stars. The colors represent observed stellar surface temperatures (with red being cooler than blue). The striping that is visible emanating outwards from the galactic plane is a result of Gaia’s sky scanning pattern (and is not a real feature of our galaxy).
Embedded below is a rendered movie flying through the Gaia data using Firefly and including all stars within the field of view with 3D positions and velocities. The motions of the stars shown in the video are extrapolated over time using the (present-day) observed velocities from Gaia.
Future Ideas
Firefly is still in active development. To “whet your appetite”, here are a few additional features that we hope to include soon:
- Expanded VR support: Firefly can be viewed in VR via Google cardboard or another VR capable device. Currently, the user can look around in VR (which is already pretty cool!). We hope to expand this feature to allow the user to also navigate throughout the scene in VR.
- Data selection and return to Python: One important workflow in many data analysis processes, especially those using interactive tools, is to identify the most interesting region interactively, select the important data, and then analyze it in more detail later. Currently in Firefly, the user can identify their location within the dataset based on the camera location, but there is no tool to select data points. Data selection in 3D is a difficult task, but we’re working to incorporate this feature into Firefly in the future. (And if you’re eager to check it out, you can look at our “data_selection” branch here.)
- 2D plotting: Currently Firefly is only set up to visualize 3D scenes, but it should be straight-forward to instead produce 2D scatter plots that can be explored using Firefly’s robust user interface.
I hope this motivates you to try Firefly! If you have feedback and/or feature suggestions, we would love to read them using Firefly’s GitHub issues tab. And if you crave more Firefly information, you can read our journal article.
As usual, if you have a project in mind or have any other data visualization need (not necessarily related to Firefly), I’d be happy to work with you. Please click here to submit a consultation request.
