
Author: Kevin Li (kevinli2024@u.northwestern.edu)
As a former competitive golfer, I have always enjoyed watching the PGA Tour. Whether it is the Masters, British Open, or the RBC Canadian Open, the thrills of the final round competition provide inexplicable and oftentimes heart-wrenching excitement.
As a start and stop sport, the game of golf offers numerous statistics — driving distance, number of putts, green in regulation percentage, etc… — that build together to describe a player’s performance. In recent years, the PGA Tour, in partnership with ShotLink, has made this data available to the general audience. Using this data, I decided to explore the relationship between various data points and whether they could serve as an accurate predictor of a player’s FedexCup Earnings.
Importing and Cleaning Data
First, we import the dataset made available by Kaggle, and we select the various data points that we think could predict earnings.
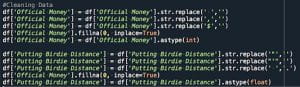
We notice that two columns — Official Money and Putting Birdie Distance — contain either NaN values or need to be cleaned to reflect an integer value.
Analyzing and Cleaning Data
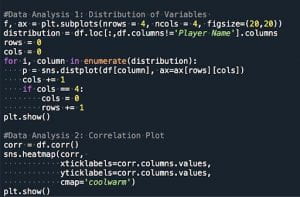
First, it is important to look at the distribution of each statistic and correlation plots to get a general impression of the trend.

From the figures above, it is not surprising that the Approach Distance, Scoring averages, and Average Putts are normally distributed. It is quite interesting to note that the Official Money plot is largely right-skewed, showing the rarity it is for a player to earn above one million in tournament earnings.
Another interesting trend to note is the relationship between Club Head Speed and Driving Distance. On a theoretical level, the two distributions should be identical with little discrepancy. However, we see that there is a visible difference between the two distributions, most likely due to the fact that shorter-hitters (with lower club-head speed) are more efficient with their ball speed conversions.
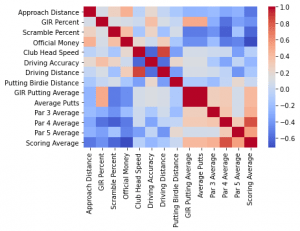
From the correlation plots, we notice the following patterns:
- Par four and Par five Scoring Averages have a much greater correlation than Par three Scoring Average. This means that on a relative basis, Par five performance is the most important.
- Of the four main areas of the game — Driving, Scrambling, Approach Shot, and Putting — we see that Iron Play and Putting are still the most important factors. Despite the rise in long-distance hitters over the past few years, we see that the importance of shorter clubs still dominates.
- Green In Regulation percentage, as expected, has the greatest correlation with Par four Performance.
- Scrambling performance also has a greater correlation with Par 4 Performance.
- We see that Putting is much more important on Par three and Par fours than Par fives. This is most likely because Par five performance relies much more on the first two to three shots (longer clubs).
Let us now more closely examine the relational plots.
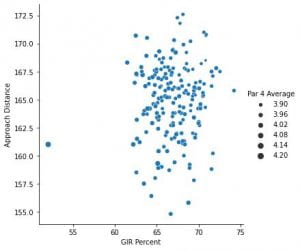

From the first plot, we see that Approach Distance as GIR Percent has little relationship. One would assume that having a shorter distance into the green would increase one’s chances of finding the green.
However, from the second plot, we do see a very positive correlation between Driving Distance and Par 5 Performance — and correspondingly, Official Money.
Machine Learning Portion
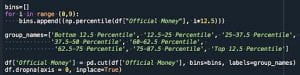
Preparation: Grouping the FedexCup Earnings into 8 bins, based on percentile.
We then use Python functions for the Logistic Regression, Random Forest Classifier, and the Support Vector Machine.
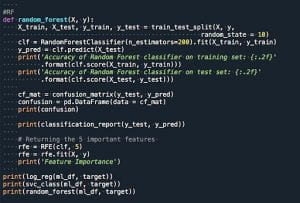

We see the result as follows:
![]()


We see that with this, the Random Forest Model and the Support Vector Machine Models could classify players’ annual FedexCup Earnings with moderate accuracy.
Be the first to comment on "PGA Tour Exploratory Data Analysis and Machine Learning Predictive Model"