
Author: Dan DeMonte (Weinberg ’20)
Even though the NHL season has been suspended indefinitely, there’s still plenty to talk about to keep the game alive, especially when it comes to hockey analytics. Moments of pause like this are a great chance to delve back into the numbers from this season. Here’s a quick guide to understanding the fundamental hockey analytics.

Arizona Coyotes GM John Chayka has been one of the most avid supporters of using analytics in hockey (Photo: David Wallace, The Arizona Republic)
Here are the advanced stats that will be useful even for the most novice of hockey fans:
Corsi
Corsi, though it sounds a bit complicated, is quite simple. It represents a plus/minus statistic for shots on goal for a given player. Similar to how a player finishes a game with a plus/minus stat, say +2 goal differential after a good game and -2 goal differential after a bad game, the same plus/minus type statistic is calculated for each player based on the number of attempts towards the goal in a given period of time, rather than having them only count on the stats sheet if the puck goes into the net for either team.
This could be useful for a player who had a good shift with a lot of time spent in the offensive zone with a good number of chances towards the opposing teams net but was on the ice of a goal against that was the only shot the opposing team had. It also helps contextualize a player’s worth and contribution to a team, highlighting a good player on a bad team or a bad player on a good team in a way that plus/minus would miss.
That being said, Corsi is not usually used by itself but is rather a starting metric to use with other advanced statistics, such as Fenwick or expected goals.
Fenwick
The difference between Fenwick and Corsi is that blocked shots are not counted in Fenwick. Only shots on goal or ones that go toward goal and miss are counted in Fenwick. Though this stat isn’t used as much as Corsi, it is useful when evaluating players who play on teams who have shot-blocking as part of their internal playing schemes (meaning they are fine with allowing more shots but want their defencemen to put an emphasis on blocking these extra shots). This is especially important with defencemen, as blocking many shots over a season means you are spending a lot of time in your zone.
Expected Goals
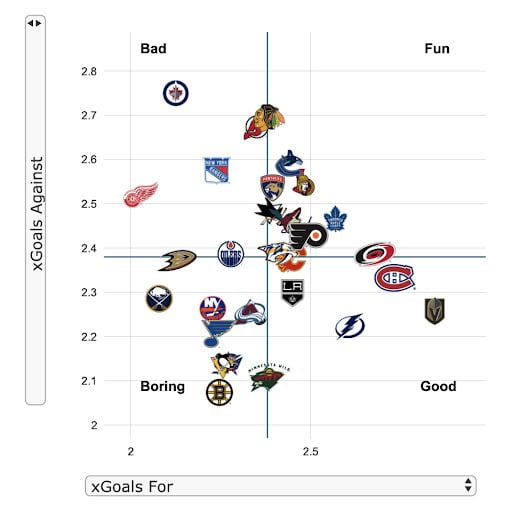
Above is a chart showing the xG for and against of each NHL team this season.
Expected goals help to cover some of the blind spots that come about from Corsi and Fenwick.
Websites like MoneyPuck, referenced often for playoff odd percentages, use it often both for skaters as well as goaltenders. Normally styled as xG, this stat is calculated in order to see how dangerous a team’s shots were, which gives more context to a team’s chances.
For example, in a given game one team may be outshooting the other team two times over, but if that team has only had weak, uncontested shots from outside the slot, those ten shots might not mean much. On the other hand, the team with five shots may have had only high danger shots from between the faceoff circles and the goal, which are much more likely to go into the net.
The models for xG evaluate each shot that went toward the net (unblocked). Most noted is the placement of the shot, but also accounted in this are the type of chances, whether those be rebounds off an initial shot or a quick shot off the rush. From these factors, a value is assigned to the chance based on the likelihood of the shot going into the net. A weaker shot from the point may have an xG of 0.02, while a backdoor pass play may result in a shot with a xG of close to 0.35. By using this, Corsi gains another dimension and each shot is given more context. Each metric is important for its own reasons.

Above is an example of a graph using Corsi and xG with every team during the 2019-20 season.
PDO
Another stat that helps to bring these metrics into a real-world context (and works well with xG) is PDO, also known as shooting plus save percentage or SPSV% by the NHL. PDO uses a combination of on-ice shooting percentage plus save percentage to show how “lucky” or “unlucky” a team is. A PDO that is above 1.000 is considered lucky, while a team with a PDO stat of less than 1.000 is considered unlucky. PDO is important due to the nature of how hockey is played. One of those high danger shots for the team with five shots from the xG example may have come when a puck bounced off a stanchion and into the slot. This high danger scoring chance was then more luck than skill, and PDO helps to account for this luck.
According to The Success Equation: Untangling Skill and Luck in Business, Sports, and Investing by Michael J. Mauboussin, hockey has the most luck involved of the five major professional sports, which include hockey, soccer, basketball, baseball, and football. Skill, according to his findings, account for less than half of the outcome over the NHL regular season. There are so many factors that go into PDO’s metric of luck. An uneven ice surface, each stadium’s rink setup, and even the weather outside all impact the way that players are able to handle the puck while in-game situations.

Bad positioning isn’t the only reason goaltenders give up so-so goals. (Photo: Vancouver Canucks, Twitter)
Now that we have defined some fundamental stats, it’s time to put them to use. Use these to better understand the nitty-gritty of the numbers as we patiently await for the NHL season to spring back to life and the battle towards the Stanley Cup, and if you ever need a refresher, just come swing on by and you’ll be all set to go.
Happy hockey! Or whatever reruns suit your fancy during this NHL-less time.
Sources:
https://www.youtube.com/watch?v=HNlgISa9Giw
https://www.sportsnet.ca/hockey/nhl/where-to-go-now-for-nhl-advanced-stats/
https://www.amazon.com/Success-Equation-Untangling-Business-Investing/dp/1422184234
https://www.sportsnet.ca/hockey/nhl/corsi-pdo-explaining-hockeys-analytics-terms/
Chayka did a very poor job and disrespected the league with his company stathletes making $.