Author: Jeremy Brooks (Weinberg ’20)
In every level of basketball, rebounding is considered in two different lights: on one hand it is the pinnacle of chaos for the sport; as rebounds can ricochet at wild, unpredictable angles and speeds. On the other hand, many espouse rebounding as a science based on physics and intuition. One common heuristic is that “long shots lead to long rebounds”. In other words, three point and deep mid range shots, if missed, are expected to result in longer trajectories away from the basket after bouncing off the rim or backboard. While this rule-of-thumb is prevalent, scientific studies1 2 have produced mixed results related to its reliability.
In addition to the physical intuition and countless anecdotal experiences supporting this notion, the advent of tracking data in the NBA allows for front office executives and casual fans alike to dig deeper into understanding how players and the basketball move throughout a game. Beginning with the 2013-2014 season, the NBA installed six cameras in each arena that track the position of each player and the basketball 25 times each second, and this data is analyzed and collected into statistics that are publicly available3. One of these statistics is the “average rebound distance” (which can be further subdivided into offensive and defensive rebounds), which provides the horizontal distance from the basket of which every rebound is collected.
By analyzing this data, it is possible to examine whether or not the conventional wisdom of “long shots = long rebounds” holds true in the NBA. The most precise way to analyze whether long shots result in long rebounds is to look at NBA play-by-play data and match the distance of every missed shot with the distance of the resulting rebound. However, collecting that data would be incredibly time demanding, so two proxies were used to examine whether or not longer shots lead to longer rebounds.
The first proxy compares the average distance from the basket that defensive rebounds are collected for each team with the average missed field goal distance that team faces. The hypothesis is, if “longer shots = longer rebounds” holds true, on average teams that defend shots that are farther away from the basket will collect defensive rebounds that are farther away from the basket than teams that defend shots that are closer to the basket. The first step is to collect data for the average field goal distance of the opposing team for each team during the 2017-2018 season. This data is available4, but because rebounds result only from missed shots, a more accurate measurement that considers only missed shots is preferable. This measurement was calculated5 using Excel for each team. The second step6 calculates the average defensive rebound distance for each team using NBA player tracking data.

Figure 1 shows no correlation between missed field goal distance and defensive rebound distance. This result indicates that even if teams were more likely to have opponents miss more long distance shots, the resulting defensive rebounds were not necessarily a longer distance away on average.
The second proxy examines the same phenomenon by comparing different seasons. This proxy compares the length of the average defensive rebound for the 2013-2014 season (the earliest that such data is available) with the 2017-2018 season (as of January 4th; season still in progress). The hypothesis is that, given the rise of three point shooting over the past several seasons, the league as a whole collects defensive rebounds that are farther from the basket now than in seasons past. The 2017-2018 data was collected during the first proxy, and the 2013-2014 data was collected using a similar methodology, but instead of collecting data team-by-team, the sample was a list7 of all players that logged 100 or more defensive rebounds.
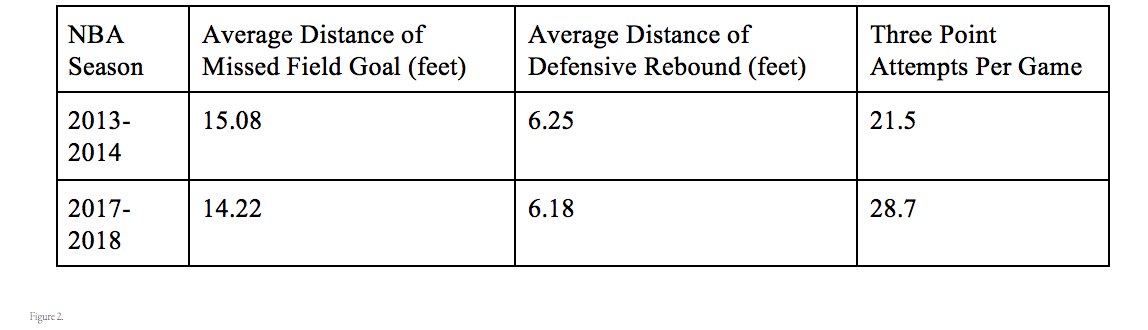
Table 2 compares the average defensive rebound distance of 2013-2014 with the average defensive rebound distance of 2017-2018, along with data showing the average shot distance for those two seasons. This comparison has the same result as the first proxy: illustrating that there is no observed correlation between field goal attempt distance and defensive rebound distance in the NBA, which undermines the prevailing sentiment that longer shots result in longer rebounds.
Despite this conclusion, the conventional wisdom should not wholly be rejected. The “longer shots == longer rebounds” logic simplifies rebounds into a one dimensional endeavor, in which the length is the distance the ball travels horizontally from the basket. However, the incredible height and athleticism of NBA players elucidates the importance of viewing rebounds as a three dimensional process in which the vertical dimension is critical. The rebounds might be set on a longer trajectory, but because NBA players routinely corral rebounds far above the height of the rim, the basketball might never have a chance to travel that far away. Without easily accessible three-dimensional tracking data, it is hard to analyze changes (or, a lack of change) in rebound trajectories due to increased field goal attempt distance in the NBA.
A second reason that the conventional wisdom may still hold true is that the distance of offensive rebounds was not considered. Because the defense is typically aligned “inside” the offense during play and after a shot attempt, the longer rebounds may more likely be offensive rebounds because they sail far from where the defense is focused. Additional research on the connection between field goal attempt distance and offensive rebound distance could confirm or deny this possibility.
The phenomenon of rebounds remaining short even as the average shot distance increases has several implications. First, it solidifies the importance of randomness in rebounding: good positioning, boxing out, and athleticism are the keys to rebounding, but only because those traits help overcome the stochastic bounces of ball on rim, not becausing rebounding is an exact or even easily predictable science. Second, the phenomenon demonstrates that the NBA’s current “pace-and-space” era has not significantly altered rebounding, at least superficially. The longer average shot distance and the collection of rebounds from smaller, nontraditional rebounders (like Russell Westbrook or James Harden) has lead some8 to theorize that longer rebounds are more prevalent than seasons past, but the basic geometry of rebounding can not be shown statistically to change. Third, teams may find value in using this data for personnel. The confirmation that rebounds still land close to the basket highlights the continued importance of playing traditional rebounders.
While rebounding has long been basketball’s most chaotic element, this project demonstrates that even the commonly accepted notion that longer shots lead to longer rebounds may have limited validity when applied to NBA tracking data.
Sources and Methodology
1. http://www.sciencedirect.com/science/article/pii/S1877705813010540?via%3Dihub
2. http://www.shobix.co.jp/hpm/tempfiles/journal/2009/08J058.pdf
3. https://stats.nba.com/players/rebounding/
4. https://www.basketball-reference.com/leagues/NBA_2018.html
5. This is the formula used to calculate the average missed field goal distance for each team’s opponents:
Distance of average missed field goal = [1.5(1 – FG% from 0-3 feet) + 6.5(1 – FG% from 3-10 feet) +
+ 13.5(1-FG% from 10-16 feet) + 19.5(1-FG% from 16 feet to three point line) + 24(1-3P%)]
divided by ( 1 – overall FG%).
This formula uses coefficients that approximate the average field goal attempt distance for each distance range of field goal attempts, as found on the aforementioned Basketball Reference page. This approximation is inexact because it assumes the average field goal attempt distance of each range is the numerical average of the two numbers that define the range (or, in the case of the varied-distance three point line, an approximation of the average). However, this approximation is an improvement on the average field goal attempt distance data.
6. The data found here (and for every other team) was used to calculate the average defensive rebound distance for each team during the 2017-2018 season (accurate as of January 4, 2018, when the data was collected). Using Excel, four columns were made: the names of each player on a given team, the number of defensive rebounds the player collected throughout the season, the average distance of a player’s defensive rebounds, and a column giving the product of the second and third column for each player. The sum of column four yields the total distance a team rebounded, and when divided by the sum of column two (total defensive rebounds), the resulting number is the average defensive rebound distance for the entire team. This data was collected for all 30 teams, and the average of the 30 team’s defensive rebound distance was used to approximate the average defensive rebound distance for the entire league during the 2017-2018 season.
Be the first to comment on "Do Longer Shot Attempts Mean Longer Rebounds?"