This November, voters will cast ballots for dozens of local, state, and federal offices. Illinois voters will also decide on a ballot measure that would amend the state constitution and permit state legislators to tax income under a graduated tax system, from its current flat-tax system. If the change is enacted, the state legislature is expected to consider a specific “Fair Tax” proposal that would tax income above $250,000 at a higher rate.
The campaign against the ballot measure argues that a constitutional amendment would allow legislators to increase taxes across all income levels without accountability and kill jobs. They also claim that it would not offer tax relief to middle- and lower-income taxpayers. Proponents of the ballot measure argue that the current flat income tax system disproportionately burdens low income households, causes budget deficits, and limits funding for government services. The “yes” campaign claims that the amendment would add an additional $3 billion in state income tax revenue under the current plan to tax income earned over $250,000.
While state constitutional amendments rarely attract much attention on the ballot, this measure has attracted the vocal attention of some of the richest people in Illinois — and they have put their money where their mouth is. Multi-billionaire and the richest man in Illinois, Ken Griffin, has already contributed $46.75 million of his $12.8 billion fortune toward opposing the measure. Last week, Jennifer Pritzker joined Griffin to oppose the measure, pitting half a million dollars against her cousin, the governor of Illinois, J.B. Pritzker, who has committed $56.5 million of his $3.4 billion in support of the amendment.

Figure 1: We looked at the most recent campaign filings with the IL Board of Elections from PACs on both sides to see how each side is looking heading into the final month of campaigning. (Figures represent PAC finances as of September 30, 2020).
Figure 1 shows recent data from political action committees focused on this measure. “Yes” figures are aggregate amounts from all three PACs in support of the ballot measure: Vote Yes For Fairness, Vote Yes for Fair Tax, and Yes to a Financially Responsible Illinois. “No” figures are aggregate amounts from all four PACs opposing the ballot measure: Coalition to Stop the Proposed Tax Hike, Say No to More Taxes, Chambers Against Progressive Income Tax, and Vote No On The Blank Check Amendment. As it turns out, Griffin and Pritzker have each contributed similar proportions of their respective side’s war chest, at 93.2% and 93.8% respectively. As the figures stand according to the most recent campaign filings, both campaigns have emptied less than half of their coffers. Both campaigns appear to significantly ramp up spending between now and Election Day.
But the contest over the ballot measure is more complicated than just that. After all, it’s up to Illinois voters to decide. To predict how Illinoisans might vote on the ballot measure, we expect that those who would pay more income tax under a graduated system, earners of over $250,000 per year, would oppose it. On the other hand, we expect that those who would stand to benefit the most from a graduated income tax, earners under $250,000 per year, would support the measure. Is this how it pans out?
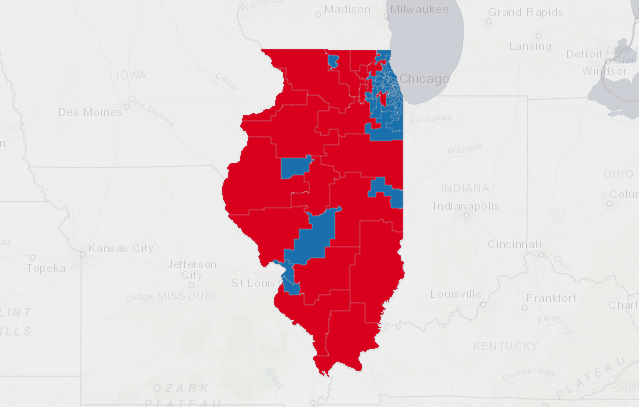
Using data from the U.S. Census American Community Survey (2014-2018) and the CPS Annual Social and Economic (March 2020) Supplement survey, we estimated the percentage of residents earning more than $250,000 per year. The graduated tax measure was put on the ballot through strict party-line votes in the Illinois State House and Senate with Republicans voting against and Democrats voting for, which allowed us to map the party affiliation of each state senator with darker shades denoting higher percentages of residents that would be affected, as seen in Figure 2 above.
What’s the Matter with Downstate?
Here’s another look at how income is distributed throughout Illinois, that transforms each senate district by the estimated number of people who earn over $250,000.

Figure 3: Illinois Senate District cartogram that transforms district size by the number of $250,000+ earners.
Most Illinois wealth is concentrated in Chicago and its surrounding suburbs, including the state’s highest concentration of earners who would pay more under the proposed graduated tax system. Downstate districts would benefit because relatively fewer constituents would see tax increases while tax revenue from wealthier districts is simultaneously redistributed to them. This again illustrates the surprising votes of downstate state senators to oppose the ballot measure.
What accounts for this seeming paradox? It might partly be explained by a hope that one will eventually belong to a higher tax bracket, so a “no” vote anticipates future earnings that would be taxed at a higher rate. It could also be because of a partisan difference in how Republicans and Democrats see wealth, the former as an individual enterprise and the latter as a communal exercise. Perhaps it is more simple than that: in a country divided by partisan politics, Republican legislators cannot support Democrat-backed policies, including those that would see more money flowing into their districts.
A stronger explanation might be found in demographics, specifically in the percentage of white residents in each senator’s district.
In a state senate map showing the percentage of white residents, districts whose senators voted against the measure tended to have higher percentages of whites. As Jonathan Metzl explains in his book, “Dying of Whiteness: How the Politics of Racial Resentment Is Killing America”, white Americans implicitly commit considerable effort to defend their position atop the country’s racial hierarchy. As a result, they throw support behind policies and politicians that may ultimately harm them if they anticipate that non-whites will be hurt as well. In the case of a graduated tax system, many whites may see it as a way to prop up welfare and social programs that are often associated with minorities, such as the stereotypical “welfare queen”. While we have yet to see what Illinois voters decide, we expect that this phenomenon explains much of the resistance to the graduated tax ballot measure.
How Unequal is Illinois, Really?
Graduated tax systems are generally praised as a partial solution to income inequality, but how big of a problem is this in Illinois? We looked at income inequality in individual senate districts, measured by a GINI coefficient reported in the U.S. Census Annual Community Survey. GINI coefficients range between zero and one with a measure of 0 denoting complete income equality and a measure of 1 denoting complete income inequality.
In 2017, the Organization for Economic Cooperation and Development (OECD) calculated that the United States GINI coefficient was the seventh highest of OECD countries at 0.39. Illinois GINI coefficient rests at 0.48, with a lone senate district clocking in below the national average. All fifty-eight other senate districts are higher than the national average, peaking in the 13th district at 0.60.
This suggests that if greater income equality is a legislative goal, substantial work is still to be done in Illinois. Furthermore, income inequality is still pervasive across the state as a whole and individual state senate districts. A graduated tax system might very well be a part of the solution if it receives ‘yes’ votes from more than 50% of election voters or more than 60% of those voting on this question. Will Illinois join the 41 other states that have adopted graduated income tax systems? We’ll see on November 3rd.
You must be logged in to post a comment.