
(Photo credit: Michael Kappel)
By Kumar Ramanathan, Matthew Nelsen, and Tom Ogorzalek
As protests against racism and police brutality continue across the United States, issues of policing have come to dominate the local political agenda across the country, including in Chicago. Activists have proposed defunding the police, removing police officers from schools, civilian accountability of police, and numerous other policies. In light of ongoing public discussion on these proposals, this blog post shares findings from recent surveys that highlight stark differences in experiences and views of policing across racial groups in Chicagoland. Underscoring the voices of activists and protestors, we find that Black residents disproportionately experience negative encounters with police, sharply disapprove of their performance, and express more concern about crime.
(Dis)approval of police
In late 2018, we surveyed 2,401 residents of Chicago and its suburbs in the Chicago Metropolitan Area Neighborhood Study.1 The survey oversampled areas undergoing demographic change, such as gentrifying city neighborhoods and suburbs with growing Black populations. In our analyses here, the survey responses are weighted to reflect the demographic makeup of the Chicago region.2 While our survey includes a large number of non-Hispanic White (n=1,598) and Black (n=475) respondents, the smaller numbers of Latinx (n=204) and Asian or Pacific Islander (n=146) respondents means that findings about the latter groups should be interpreted with caution.3
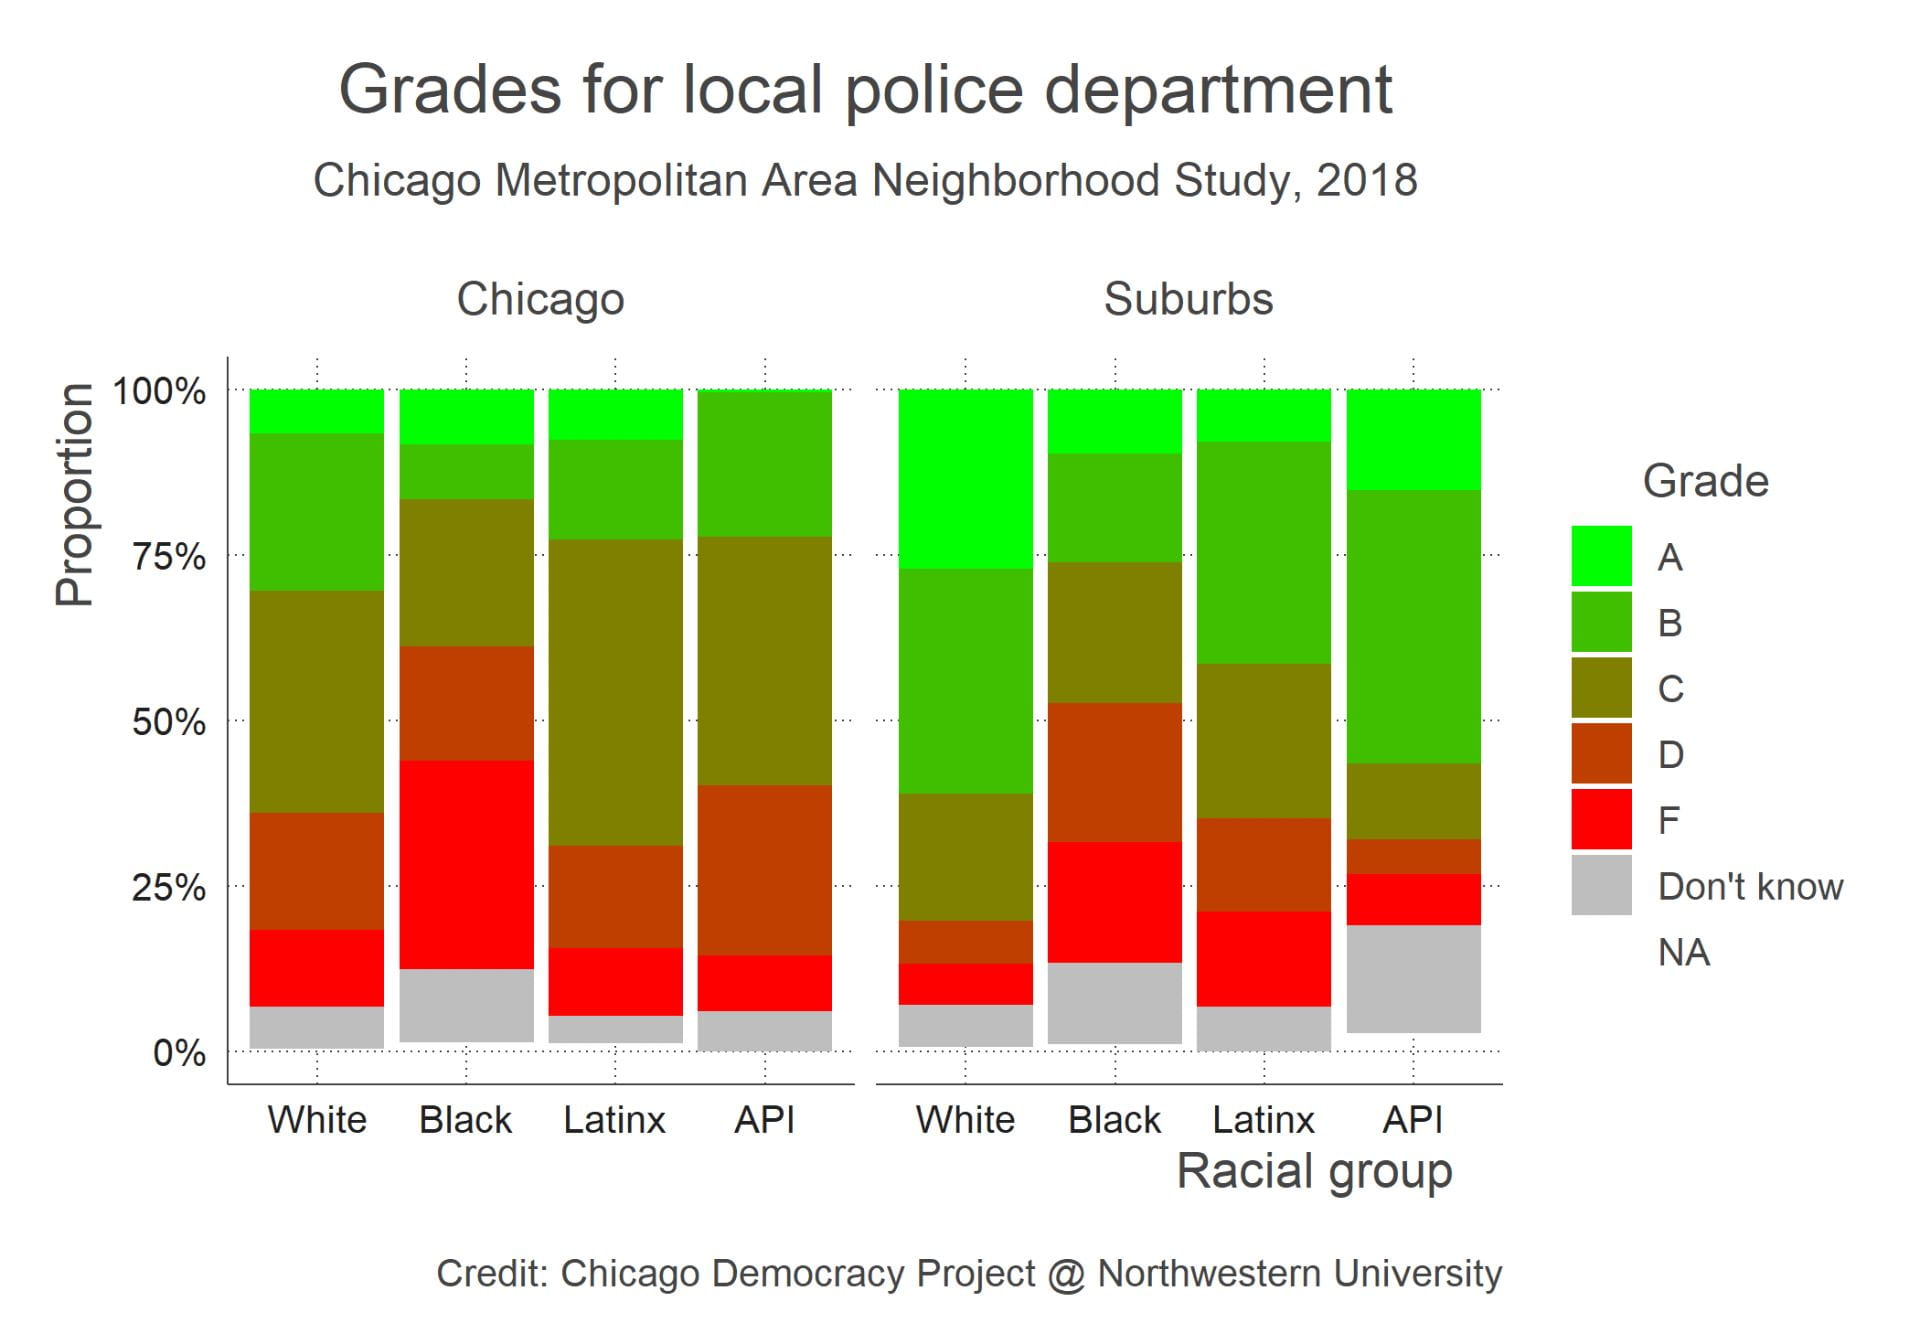
We asked participants to evaluate the performance of 12 local agencies and officials, including their local police department, using letter grades from A to F. As Figure 1 shows, Black residents gave the police much lower grades than other racial groups, followed by Latinx residents. The difference is starkest between White suburban residents, who give their police departments a B- grade on average, and Black city residents, who gave the Chicago Police Department a D+. Among White suburbanites, police departments were the most popular of the agencies and officials listed. Among Black Chicagoans, only then-Gov. Bruce Rauner and Donald Trump received lower grades than the police. In any case, there do not appear to be a lot of police departments making the Dean’s list, a view reflected in the increasingly widespread public support for police reform.
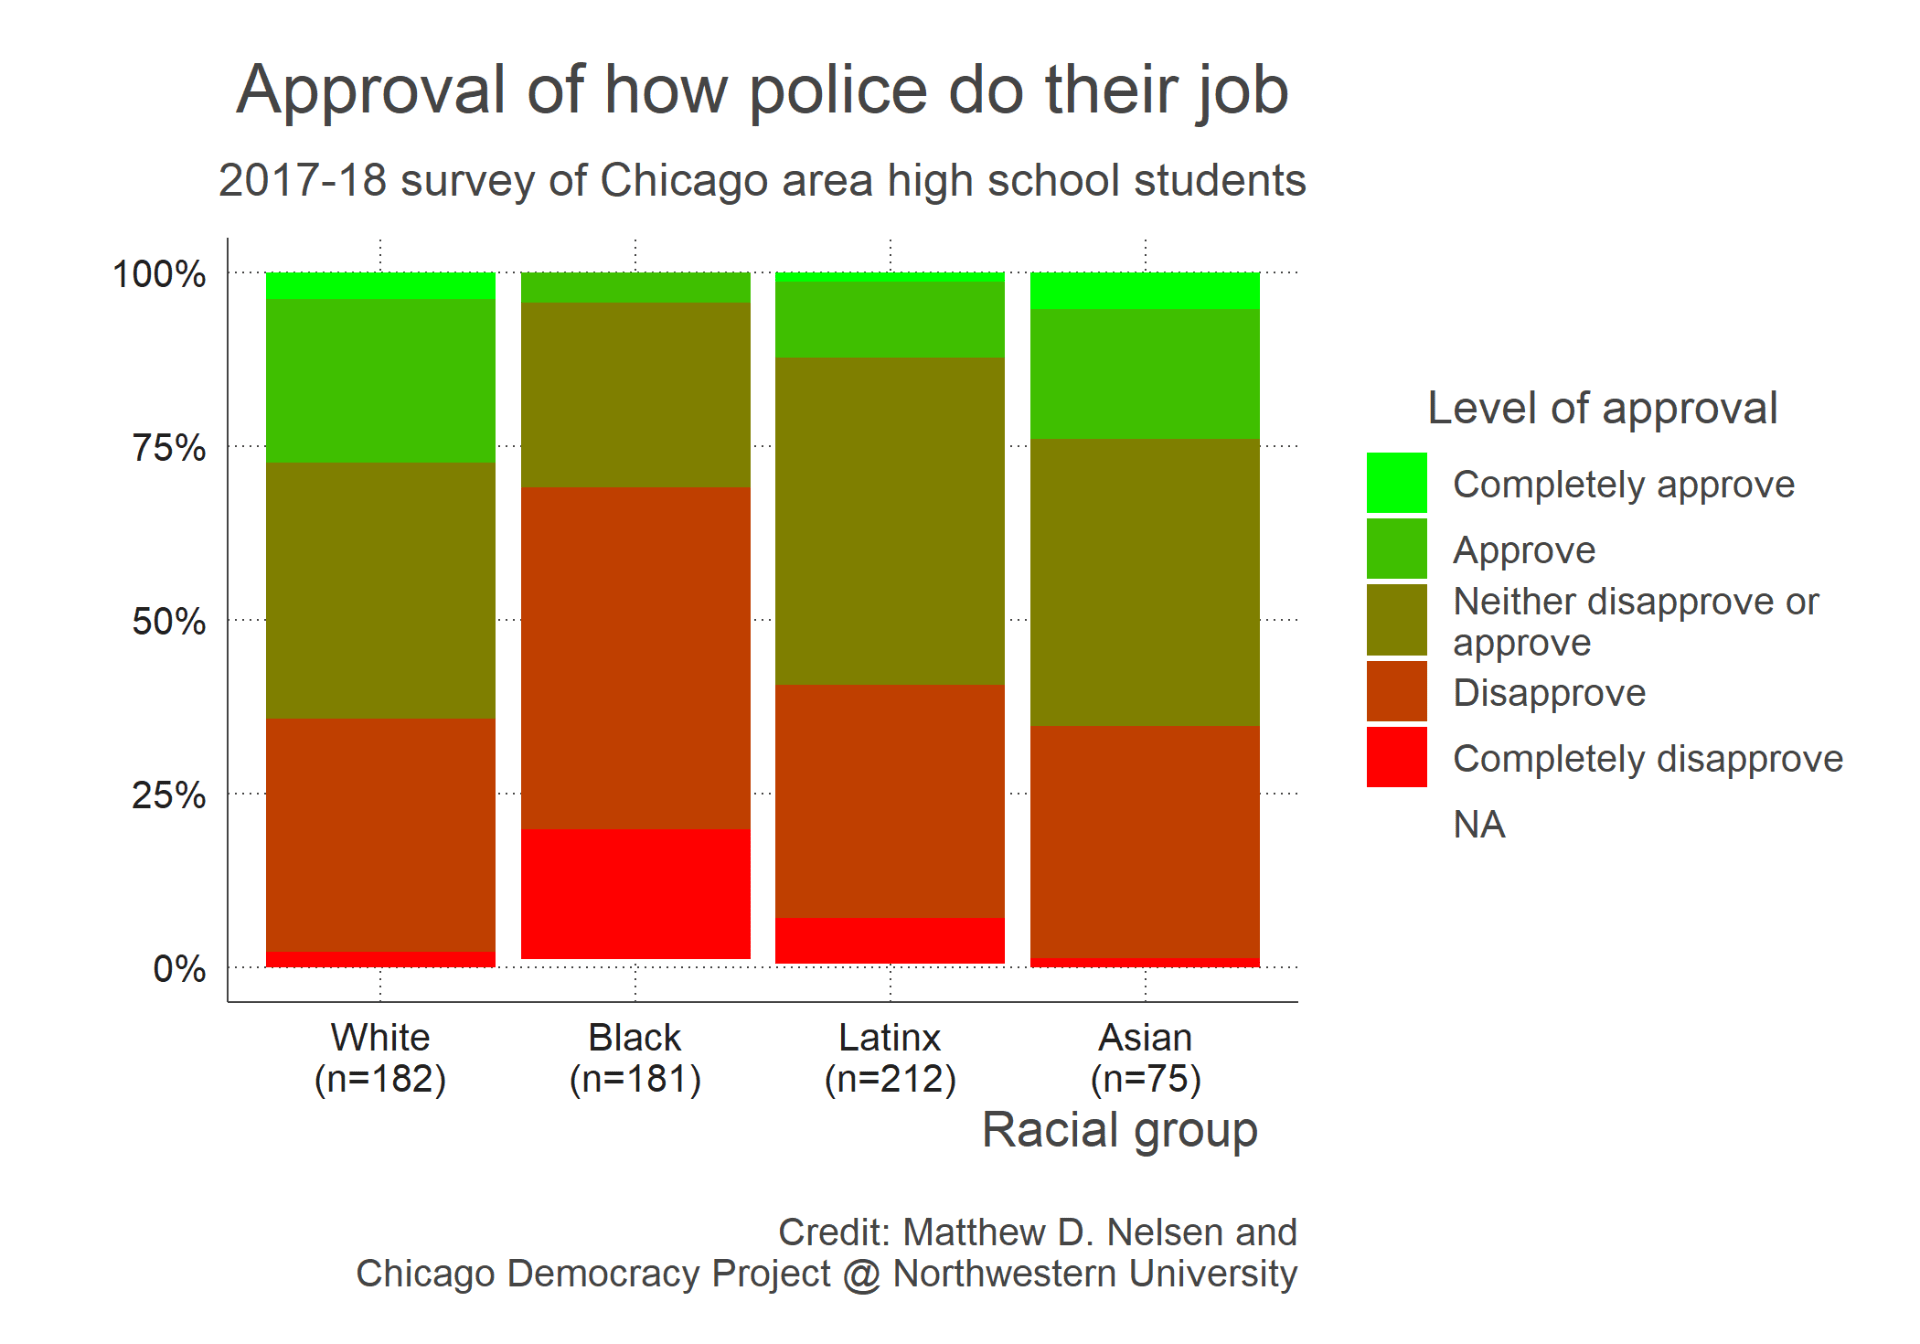
We are also able to examine approval rates of police among youth, drawing on a survey of 700 high school students (aged 14-18) we conducted as part of an educational study in the Chicago area. While the sample was not representative, it included significant oversamples of Black and Latinx youth, allowing us to better examine differences in opinion across race. The youth surveyed expressed low rates of approval of the police overall, with divergent patterns across racial groups. Around 25 percent of Asian and White youth reported that they either approve or completely approve of how police are doing their job. However, only 12 percent of Latinx youth and 4 percent of Black youth expressed approval.
Black youth in particular expressed high rates of disapproval: 69 percent of the Black youth in this sample disapproved or completely disapproved of how police are doing their job, while White, Asian, and Latinx youth expressed higher rates of ambivalence. Similar trends emerged when we asked students to report their trust towards the police. The intensity of disapproval and distrust of police among Black youth should be taken into consideration in debates over the presence of police officers in public schools.
Experiences of policing
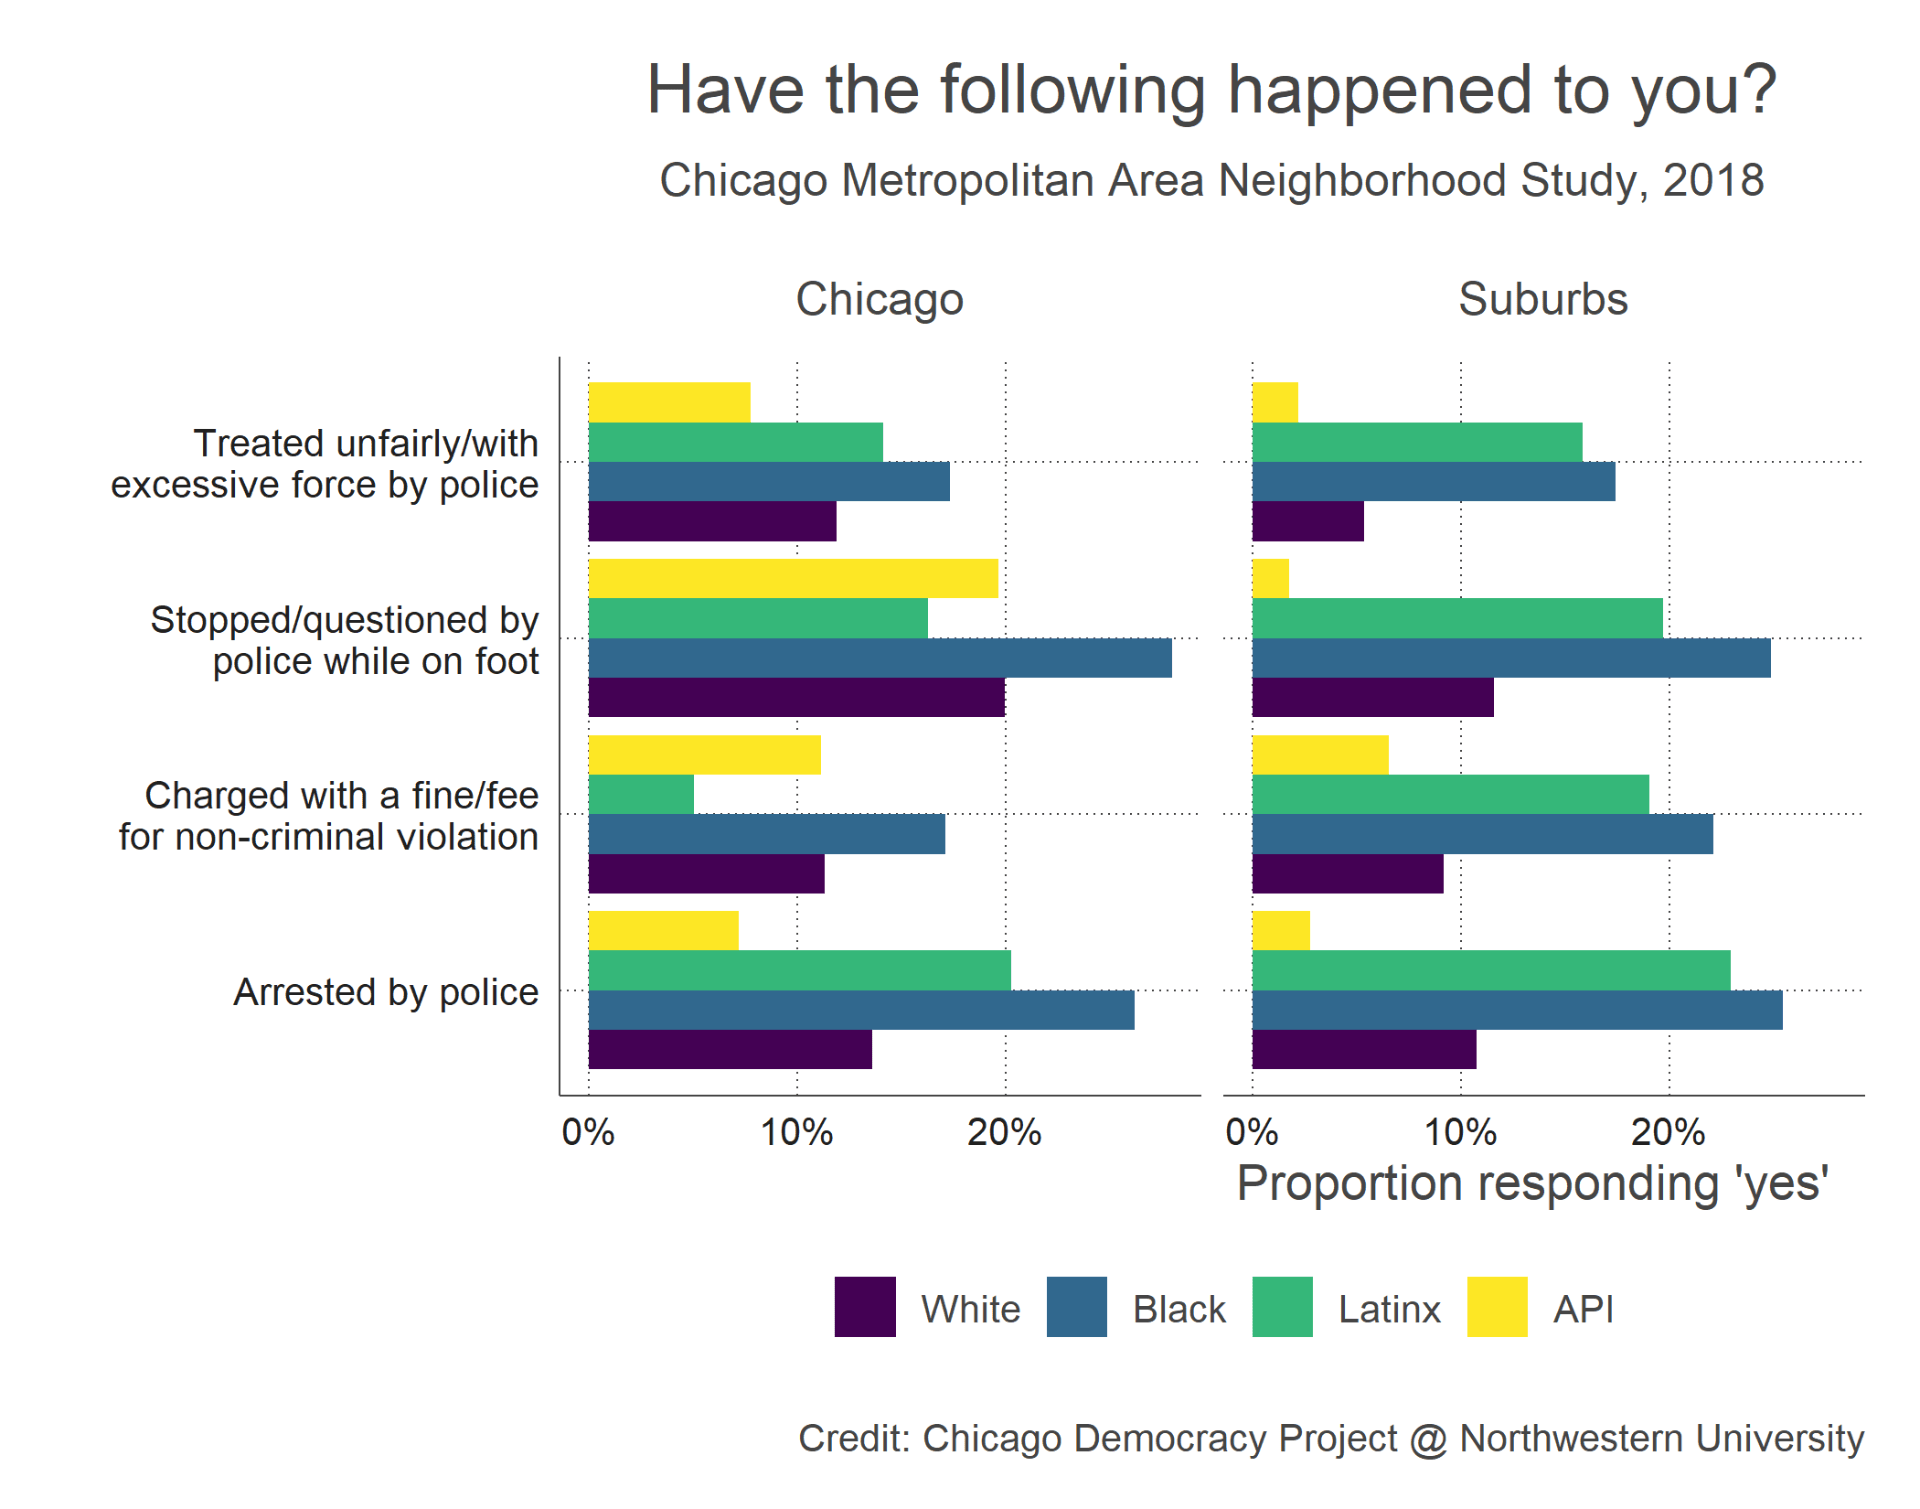
Low approval of police among Black residents corresponds with negative experiences with policing. In our 2018 survey of Chicago area adults, we asked whether respondents had experienced one of four types of negative policing encounters. Figure 3 shows that a higher proportion of Black residents experienced each type of encounter at higher rates than White residents (and indeed than all other racial groups), in both Chicago and its suburbs.
Another way to illustrate the racialization of policing is to consider whether the experiences of residents vary when we compare the least and most White parts of the metropolitan area. As Figure 4 shows, fewer residents in the whitest parts of Chicagoland reported experiencing each negative encounter.4

Concern about crime
While Black residents of Chicagoland are more likely to experience negative policing encounters, they are also more concerned about crime. As Figure 4 shows, Black residents in Chicago and its suburbs express higher levels of concern than White residents. The juxtaposition of concern about crime and negative experiences with policing reflects what Gwen Prowse and Vesla Weaver have called “distorted responsiveness”, where residents of highly-policed communities described being constantly surveilled during daily activities but not receiving help from police when serious harm occurs.

Allocating public resources
Our survey also asked respondents to allocate resources from a finite local budget across thirteen spending categories. Unfortunately, the measure does not directly assess attitudes towards police funding, because the question grouped together “funding for police and programs to reduce crime and gun violence” as one category. Nevertheless, it is striking that among White respondents, this category ranks second in budget allocation (after education and schools) on average. Meanwhile, Black and Latinx respondents allocate more resources to economically redistributive policies—aid for the poor, guaranteeing a living wage, and promoting economic development and jobs. Advocates of police defunding have argued that these funding decisions are related, as more funding for public services and reducing inequality could alleviate the root causes of crime.
Overpoliced and under-protected
These survey results concur with decades of research showing that Black and Latinx people in the United States, especially those living in low-income and segregated neighborhoods, disproportionately encounter police and experience higher levels of harassment, intimidation, and violence during those encounters. Our recent surveys find similar patterns in Chicagoland, especially among Black communities. At the same time, Black residents report higher levels of concern about crime, underscoring that the more intensive policing they experience is not achieving its ostensible goal. These findings echo historian Simon Balto’s argument in his book Occupied Territory that Black communities in Chicago and elsewhere are “both overpoliced and under-protected.”
As the recent nationwide protests and decades of activism have asserted, policing means something very different in Black communities than it does in White ones. These patterns are reflected in the starkly divergent experiences and views of policing in Chicagoland, and should inform ongoing debates over the future of policing and public safety.
Footnotes
- We are thankful to Traci Burch for adding some of the questions about policing and supporting the funding of the survey. ↩
- The survey weights correct for sampling error based on sex, race/ethnicity, education, income, and age. In the raw Internet-based sample, men, Latinx, older, poorer, and less formally educated respondents were under-represented, so weighted and unweighted analyses differ more in these groups. The main comparisons between White and Black respondents in this blog post remain consistent with our without weighting. ↩
- The survey firm that we hired asked two questions about racial identification: one on “race and ethnicity” and one on “Hispanic/Latino identity”, similar to the U.S. Census. Respondents could only choose one response per question. In this post, “White” refers to non-Hispanic Whites only. Where respondents selected Black or Asian/Pacific Islander and indicated a Hispanic/Latino identification, we count them in within-group analyses for both groups. We would prefer measures that allow for multiracial identification and resist the “Asian or Pacific Islander” grouping, but were unfortunately constrained by the survey design. For more details, please contact the authors. ↩
- Figure 4 plots smoothed conditional means estimated using generalized additive models, with 95% confidence intervals shown in the grey bars. For more details, see documentation for the procedure here. ↩
You must be logged in to post a comment.