Author: Wyatt DeYoung (Weinberg ’22)
Anyone who’s played baseball knows that the harder the pitch is thrown, the harder it is to make contact. This process manifests itself in higher strikeout numbers for pitchers who throw faster every year. But if speed was the only thing that makes up a good fastball, then there would be a near perfect correlation between velocity and swinging strike rate. That being said, there are pitchers who throw hard fastballs and don’t generate many swinging strikes and those who make hitters whiff at fastballs in the high 80s. So what other factors dictate the effectiveness of a fastball?
To answer this question, I looked at data from thousands of fastballs thrown over the course of the 2018 MLB season on brooksbaseball.net. Their website has statistics that go beyond how fast the ball was thrown to include where it was released, how much it moved, where it was located and the spin it had on it. I narrowed down the data set by looking at those pitches were put in play and swinging strikes. By taking the averages of each of these categories for various statistics and taking the difference of the two averages, I was able to identify what else made fastballs hard to hit besides speed.
The first data set analyzed came from the subset of every fastball from the 2018 season that was either put in play or unsuccessfully swung at. My hope was to see which factors contributed to pitchers missing bats. If these patterns existed, then I could apply those findings to individual pitchers to see why their swing and miss percentage is the way it is. The results can be seen below:
All 2018 Fastball Data
| Release Speed (MPH) | Abs. Val. Horizontal release position (ft) | Vertical release position (ft) | Release extension (ft) | Abs. Val. Horizontal movement (ft) | Vertical movement (ft) | Abs. Val. Horizontal position (ft) | Vertical position
(ft) |
Release spin (RPM) | |
| In play | 92.42 | 1.97 | 5.87 | 6.11 | 0.8 | 1.02 | 0.44 | 2.47 | 2213.92 |
| Swinging strikes | 92.78 | 2 | 5.84 | 6.12 | 0.72 | 1.11 | 0.53 | 2.71 | 2268.05 |
| Difference | 0.36 | 0.03 | -0.03 | 0.01 | -0.08 | 0.09 | 0.09 | 0.24 | 54.13 |
The first thing that jumps out from the data is that swinging strikes were thrown .36 MPH faster than pitches put in play. This is a considerable difference when considering that the data is being taken from thousands of pitches, but is not surprising considering the data. It is also noticeable that the horizontal position (adjusted for righties and lefties with absolute value) was about an inch further from the middle of the plate. Yet this is also logical given that the further from the heart of the plate a pitch is, the harder it is to hit.
The most interesting data from my analysis seems to be that swinging strikes tend to come on pitches thrown with a higher spin rate (54.13 RPM difference), more vertical movement (.09 ft or about a 1-inch difference), and a higher vertical position by .24 ft or about 3 inches. It makes sense that these three statistics vary similarly since they scientifically correlate with one another. When a pitch is thrown with more spin, the Magnus Effect, an observable phenomenon that is commonly associated with a spinning object moving through a fluid, is increased which helps the ball defy gravity and appear to rise to the hitter. This leads to higher swing and miss rates, as can be seen by the differences in the data. An interesting article by fivethirtyeight.com breaks down this effect statistically to help you better understand this phenomenon.
With these conclusions in mind, I then focused on individual pitchers to see how they differed from league averages and what made each of their fastballs successful. I chose four very distinct pitchers with varying fastball velocities, and yet each of them finds ways to get outs with their fastballs.
Justin Verlander – Houston Astros
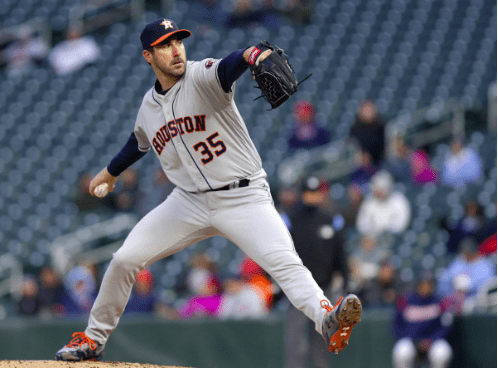
2018 Fastball Data
| Release Speed (MPH) | Horizontal release position (ft) | Vertical release position (ft) | Release extension (ft) | Horizontal movement (ft) | Vertical movement (ft) | Horizontal position (ft) | Vertical position
(ft) |
Release spin (RPM) | |
| In play | 95.14 | -1.85 | 6.84 | 5.94 | -0.92 | 1.61 | 0.08 | 2.65 | 2618.22 |
| Swinging strikes | 95.24 | -1.83 | 6.86 | 5.95 | -0.90 | 1.72 | 0.06 | 2.97 | 2629.77 |
| Difference | 0.10 | 0.02 | 0.02 | 0.01 | 0.02 | 0.11 | -0.02 | 0.32 | 11.55 |
Justin Verlander is somewhat the stereotypical example of how a fastball can be good. Verlander throws extremely hard and generates a lot of spin on his pitches. This combination netted him a whiff rate, a number that divides the number of pitches swung at and missed by the total number of swings in a given sample, of 14.5% in 2018, good for sixth in the MLB. Notice that there is not much of a change in his numbers between balls put in play and swinging strikes. There is only a slight increase in spin, vertical movement and vertical position on balls swung through. However, since all his advanced stats have characteristics that lend themselves to high swing and miss rates the first place, the lack of much difference makes sense. He already generates almost half a foot more vertical movement on his fastball, throws it faster and higher, and generates about 400 RPM more spin than the average pitcher. This provides a baseline for how to have a successful fastball in today’s MLB.
Kyle Hendricks – Chicago Cubs
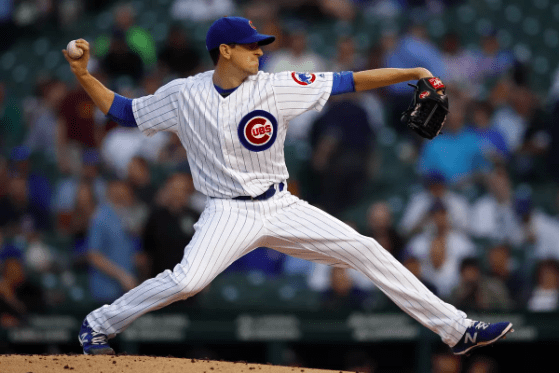
2018 Fastball Data
| Release Speed (MPH) | Horizontal release position (ft) | Vertical release position (ft) | Release extension (ft) | Horizontal movement (ft) | Vertical movement (ft) | Horizontal position (ft) | Vertical position
(ft) |
Release spin (RPM) | |
| In play | 86.99 | -2.31 | 6.19 | 5.70 | -0.94 | 0.92 | -0.10 | 2.41 | 1966.05 |
| Swinging strikes | 87.05 | -2.33 | 6.16 | 5.66 | -0.76 | 1.11 | -0.17 | 2.82 | 2025.57 |
| Difference | 0.06 | -0.02 | -0.03 | -0.04 | 0.18 | 0.19 | -0.07 | 0.41 | 59.52 |
Kyle Hendricks is worth a look because he throws considerably slower than the average pitcher and generates less spin with each pitch. Yet he still recorded a respectable 9.2% whiff rate in 2018 due to the way he mixes his fastball with other pitches. He is an expert at tunneling – making his fastball look identical to his changeup for most of the flight path. Because of this, his whiff rate on changeups was an astounding 21.9%, while only hitting 5.3% on fastballs. This shows that his fastball is used more used to induce soft contact or set up his off-speed, whereas his changeup is his strikeout pitch. So although nothing about the data would point to Hendricks having an effective fastball, his deception allows for him to get by with mediocre advanced stats.
Jordan Hicks – St. Louis Cardinals
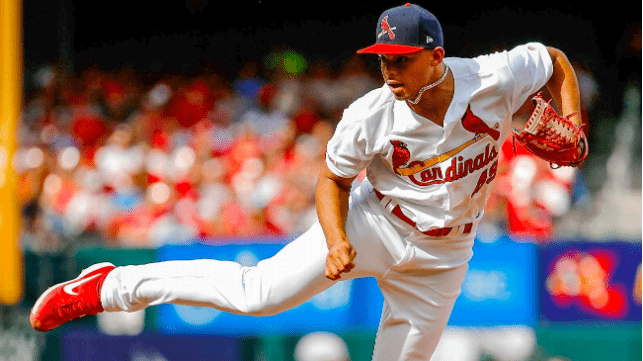
2018 Fastball Data
| Release Speed (MPH) | Horizontal release position (ft) | Vertical release position (ft) | Release extension (ft) | Horizontal movement (ft) | Vertical movement (ft) | Horizontal position (ft) | Vertical position
(ft) |
Release spin (RPM) | |
| In play | 100.33 | -1.36 | 6.19 | 6.43 | -1.13 | 0.71 | -0.14 | 2.42 | 2079.24 |
| Swinging strikes | 100.82 | -1.36 | 6.18 | 6.41 | -1.13 | 0.69 | -0.37 | 2.16 | 2110.34 |
| Difference | 0.49 | 0 | -0.01 | -0.02 | -0.00 | -0.02 | -0.23 | -0.26 | 31.10 |
Jordan Hicks is an interesting case study because he differs so much from most pitchers. While other pitchers see patterns of high velocity correlating with high spin, more vertical movement and higher vertical position, Hicks does not. He has thrown harder fastballs than any other pitcher in 2019, with an average velocity of 100.5 MPH. However, he doesn’t have the advanced stats that usually accompany high velocity, owning an average spin rate, vertical movement and vertical position all below the MLB average. This phenomenon may be the reason that Hicks only had a 6.75% whiff rate on his fastballs last year, according to brooksbaseball.com. The fact that he is still able to be successful throwing his fastball is due to the high ground ball rate (11.18%) he generates because of the lack of vertical rise on his pitches compared to most hard-throwing hurlers.
Rich Hill

2018 Fastball Data
| Release Speed (MPH) | Horizontal release position (ft) | Vertical release position (ft) | Release extension (ft) | Horizontal movement (ft) | Vertical movement (ft) | Horizontal position (ft) | Vertical position
(ft) |
Release spin (RPM) | |
| In play | 89.15 | 1.63 | 5.76 | 6.21 | 0.88 | 1.36 | 0.21 | 2.70 | 2461.73 |
| Swinging strikes | 89.53 | 1.55 | 5.83 | 6.22 | 0.84 | 1.46 | 0.41 | 3.02 | 2451.45 |
| Difference | 0.38 | -0.08 | 0.07 | 0.01 | -0.04 | 0.10 | 0.20 | 0.32 | -10.28 |
Rich Hill, on the other hand, throws nowhere near as fast as Hicks does. Instead, he relies on a “deceptive” fastball – his fastball seems much faster than it actually is. This is because he generates much more spin than the average fastball to make it rise vertically even without the speed, and hence fooling hitters. While both Hendricks and Hill throws a sub-90 fastball, Hill’s advanced stats are outstanding across the board, which shows why his fastball has been so effective.
In conclusion, all four of these pitchers found their own successes in the majors through different approaches with their fastball. Verlander is an exceptional case where he throws very hard while generating a lot of spin on his fastball, which results in a good vertical movement and thus a high whiff rate. However, not all pitchers are as gifted as Verlander is, so they need to take alternative approaches to make their fastball effective. There are other ways to get swinging strikes with fastball other than speed. Kyle Hendricks does this via tunneling – making his fastball and changeup look identical for a large part of their trajectories, thereby fooling hitters into swinging for a fastball when in fact a changeup is coming their way. Rich Hill throws a deceptive fastball with a lot of spin, making it seem much faster than it actually is. However, there is more to a fastball than just getting swinging strikes. Jordan Hicks does not get many swings and misses, but he induces a lot of ground balls with his fastballs.
It would be interesting to look further into fastball trends by altering the data set in a few ways. First of all, I would like to see if pitch count changes how pitchers throw their fastballs later in the game. I could also separate the sample into righties and lefties to see if there are any differences between how the two groups pitch. Lastly, I would want to look at a larger sample size in order to account for possible outliers in my data.
Be the first to comment on "There’s More to a Good Fastball than Just Being ‘Fast’"