Author: Chibuzo Ikonte (Weinberg ’20)
Opening Statement
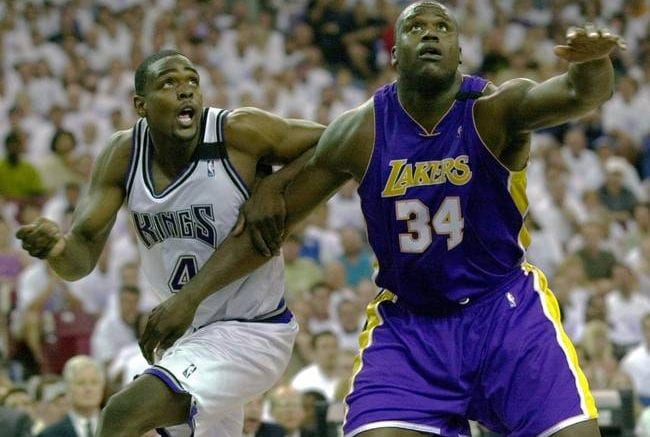
Being inducted into the Basketball Hall of Fame is one of the highest attainable individual honors that a player can achieve. It holds the power of having the worldwide recognition of being an all-time great player. It is a culmination of thousands of hours of meticulous hard work that leads to the immortalization of a player’s legacy. Given the difficulty in attaining this honor, there have been many great NBA players throughout history who have not been able to get over the hump and make it into the Hall of Fame. Chris Webber, Tim Hardaway, and Shawn Kemp are 3 players that immediately come to mind. There is no dispute about the impact that a player such as Chris Webber had on the game of basketball. He is the 1994 Rookie of the Year, a 5 time All-Star, and most importantly to me, a 5-time member of the All NBA team. The honor of being an All NBA player is, in other words, getting universally recognized as a Top 3 player for one’s position for that season. Furthermore, as I pondered why great players such as Webber and Hardaway have not made the Hall of Fame, I then wanted to learn how we can distinguish All NBA caliber players from Hall of Fame worthy players. In other words, what statistics differentiate Chris Webber from Shaquille O’Neal, and lead to one being a Hall of Famer, but the other a perennial All NBA team member but not quite enough for the HoF?
This article is motivated by the question of which statistics help to predict a Hall of Fame career, and how can we use such statistics to differentiate between a Hall of Fame NBA player and an All NBA caliber player.
In order to answer this question, I understood that I needed an appropriate dataset that could encompass the questions that I wished to address. One potential problem that I identified early on was the criteria for being inducted into the Basketball Hall of Fame. As the game continues to evolve, the way we value certain aspects of basketball also changes. As a result, I decided to select NBA players within a 30 season window to account for this evolution. By doing so, my report examined NBA players who made at least 1 All NBA team within a 30 year time period.
As it will be addressed later in the report, one difficulty I encountered was my small dataset. For example, a quadratic discriminant analysis (QDA), is one that thrives on a very large training dataset. Given that my research only encompassed 100 NBA players, I was not able to explore using a QDA model.
Nonetheless, once my dataset was identified, tidied and cleaned, my next task was conducting an exploratory data analysis (EDA). My main motivation for using an EDA was to sort out issues of multicollinearity that persisted amongst some of the predictors (box score statistics) and explore some of the trends that existed between Hall of Fame players and All NBA level caliber players.
Multicollinearity
cor(Career_EDA$G, Career_EDA$GS)
## [1] 0.919197
cor(Career_EDA$FG, Career_EDA$FGA)
## [1] 0.926772
cor(Career_EDA$FT, Career_EDA$FTA)
## [1] 0.9145684
cor(Career_EDA$`3P`, Career_EDA$`3PA`)
## [1] 0.9924963
My intuition of box score basketball statistics led me to sort out the issue of redundancy and multicollinearity that persisted amongst the predictors. I found that statistics such as 3 pointers made vs 3 pointers attempted, and field goals made vs field goals attempted, encompassed the same idea, and would thus be unnecessary to include both when I reached the model building stage.
Trends between Hall of Fame vs All NBA players; Trends amongst predictors
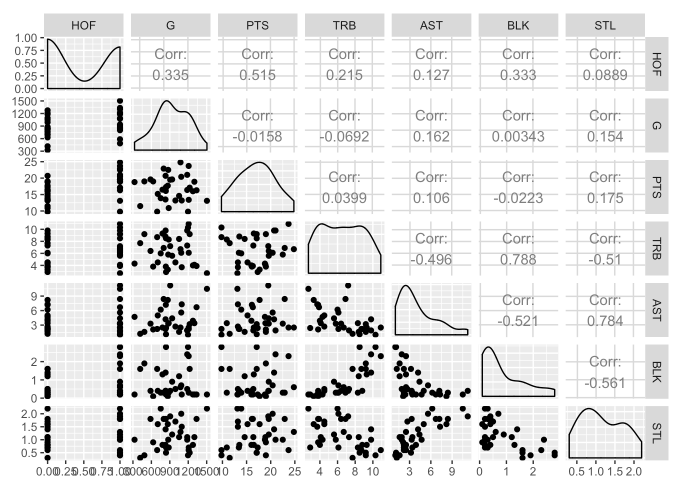
The correlation matrix was one of the trends that stuck out the most to me during my EDA. I initially was very surprised to observe that Games Played was the predictor most correlated to making the Hall of Fame. However, after thinking about it more, I realized that Games Played is a variable that is very indicative of longevity. In addition, having a long career in the NBA has been a consistent driving force for players making the Hall of Fame. If a player is able to stay in the league longer, they are more likely to also excel at things such as scoring, passing, and rebounding that lead to a longer career. It follows that Games played should be most correlated to making the Hall of Fame.
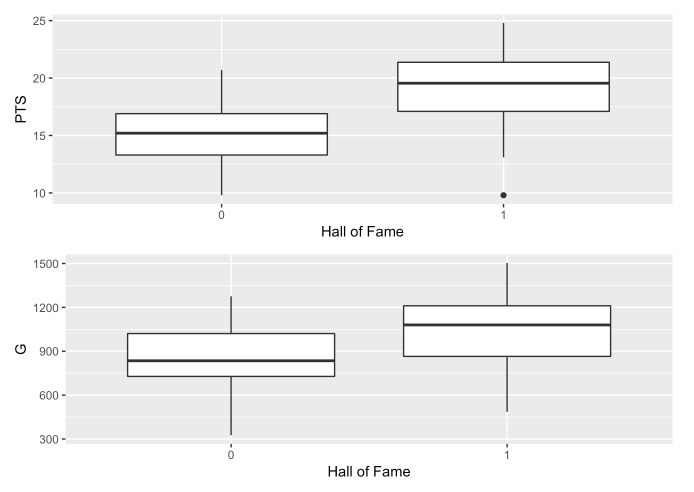
As observed here, Hall of Fame players typically had longer careers than the All NBA players and scored more points during their career.
## [1] 0.2
Only a small percentage of the players averaged over 20 points during their career. Given how closely correlated points is with making the Hall of Fame, this appears to be a statistic that would help separate a player as an All NBA level vs. Hall of Fame player.
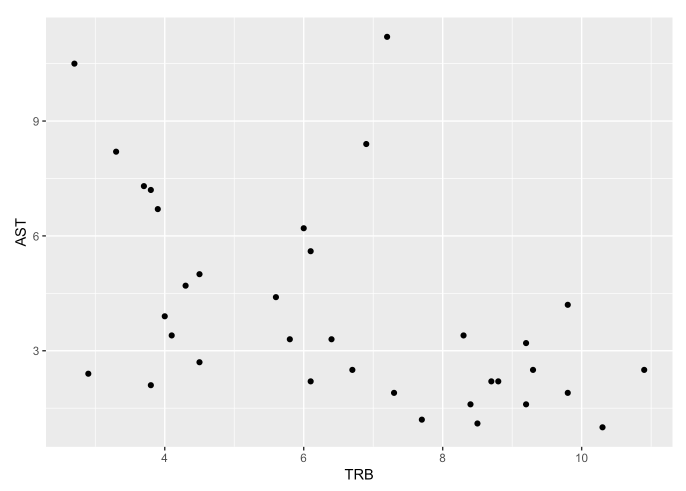
On the other hand, there is a negative relationship between total rebounds and assists. This is expected given that prolific rebounders typically consist of forwards and centers who specialize in that and less so in distributing/assists while guards get lots of assists but as a result do not bear the burden of gather rebounds.
After conducting my EDA, I have decided on the predictors I want to further investigate in the model building portion of my project: G, FG, 3P, FT, TRB, AST, BLK, STL, TOV, PTS.
Model Building
For the model selection process, I utilized the family of classification models such as Logistic Regression, LDA, QDA, and K-Nearest Neighbor. I did so because my question was framed around predicting whether or not a player would make the Hall of Fame.
First, before I elaborate upon the best and worst performing models, I want to take note of how the significant predictors were identified.
## # A tibble: 8 x 4
## data model_name lm_MLR model_fit
## <list> <chr> <chr> <list>
## 1 <tibble [55 × 9]> G HOF~ G <S3: lm>
## 2 <tibble [55 × 9]> PTS HOF~ PTS <S3: lm>
## 3 <tibble [55 × 9]> TRB HOF~ TRB <S3: lm>
## 4 <tibble [55 × 9]> AST HOF~ AST <S3: lm>
## 5 <tibble [55 × 9]> STL HOF~ STL <S3: lm>
## 6 <tibble [55 × 9]> BLK HOF~ BLK <S3: lm>
## 7 <tibble [55 × 9]> TOV HOF~ TOV <S3: lm>
## 8 <tibble [55 × 9]> FT HOF~ FT <S3: lm>
| term | p.value |
| PTS | 0.0004838 |
| TOV | 0.0009096 |
| G | 0.0066350 |
| FT | 0.0088439 |
| BLK | 0.0146069 |
| TRB | 0.0467053 |
My best performing model was an LDA while my worst performing model was Logistic Regression.
An LDA triumphs a logistic model when n is small (as is the case for me) and the distribution of the predictors X is approximately normal. They assume that they are drawn from a normal distribution. However, it is less flexible, which can lead to increased bias. That is the trade-off for the less variability present.
KNN was my second best performing model and performed almost as well as my LDA.
3 LDA Models Used
# Fit lda models
lda_fits <- Career_db %>%
mutate(mod_01 = map(train, ~ lda(formula = HOF ~ G + PTS + FT + TOV + BLK + TRB,
data = .x, control = list(maxit = 100))),
mod_02 = map(train, ~ lda(formula = HOF ~ G + PTS,
data = .x, control = list(maxit = 100))),
mod_03 = map(train, ~ lda(formula = HOF ~ G + PTS + TRB + AST + STL,
data = .x, control = list(maxit = 100)))) %>%
gather(key = model_name, value = model_fit, contains(“mod_”))
LDA error rate
LDA confusion matrix
Update LDA fits with error and confusion info
| model_name | train_error | test_error |
| mod_02 | 0.3 | 0.3090909 |
| mod_01 | 0.1 | 0.5818182 |
| mod_03 | 0.1 | 0.6000000 |
Confusion Matrices
## # A tibble: 4 x 7
## model_name train_error test_error HOF pred_HOF n prop
## <chr> <dbl> <dbl> <dbl> <fct> <int> <dbl>
## 1 mod_01 0.1 0.582 0 0 12 0.218
## 2 mod_01 0.1 0.582 0 1 15 0.273
## 3 mod_01 0.1 0.582 1 0 17 0.309
## 4 mod_01 0.1 0.582 1 1 11 0.2
## # A tibble: 4 x 7
## model_name train_error test_error HOF pred_HOF n prop
## <chr> <dbl> <dbl> <dbl> <fct> <int> <dbl>
## 1 mod_02 0.3 0.309 0 0 18 0.327
## 2 mod_02 0.3 0.309 0 1 9 0.164
## 3 mod_02 0.3 0.309 1 0 8 0.145
## 4 mod_02 0.3 0.309 1 1 20 0.364
## # A tibble: 4 x 7
## model_name train_error test_error HOF pred_HOF n prop
## <chr> <dbl> <dbl> <dbl> <fct> <int> <dbl>
## 1 mod_03 0.1 0.6 0 0 12 0.218
## 2 mod_03 0.1 0.6 0 1 15 0.273
## 3 mod_03 0.1 0.6 1 0 18 0.327
## 4 mod_03 0.1 0.6 1 1 10 0.182
A confusion matrix illustrates the prop of times that the model correctly or incorrectly predicted whether a player would make the Hall of Fame or not based upon the dataset.
K-Nearest Neighbor
KNN error rate
KNN confusion matrix code
| pred_set | k_value | test_error |
| c(“G”, “PTS”) | 6 | 0.3454545 |
| c(“G”, “PTS”, “FT”, “TOV”, “BLK”, “TRB”) | 2 | 0.3636364 |
| c(“G”, “PTS”, “FT”, “TOV”, “BLK”, “TRB”) | 4 | 0.3636364 |
| c(“G”, “PTS”, “FT”, “TOV”, “BLK”, “TRB”) | 1 | 0.3818182 |
| c(“G”, “PTS”) | 1 | 0.3818182 |
| c(“G”, “PTS”) | 4 | 0.3818182 |
| c(“G”, “PTS”, “FT”, “TOV”, “BLK”, “TRB”) | 6 | 0.4000000 |
| c(“G”, “PTS”) | 2 | 0.4909091 |
| c(“G”, “PTS”, “FT”, “TOV”, “BLK”, “TRB”) | 10 | 0.4909091 |
| c(“G”, “PTS”) | 10 | 0.4909091 |
| c(“G”, “PTS”) | 8 | 0.5818182 |
| c(“G”, “PTS”, “FT”, “TOV”, “BLK”, “TRB”) | 8 | 0.6000000 |
## # A tibble: 4 x 4
## HOF pred_HOF n prop
## <dbl> <fct> <int> <dbl>
## 1 0 0 21 0.382
## 2 0 1 6 0.109
## 3 1 0 13 0.236
## 4 1 1 15 0.273
Closing Statement
My original research question was what statistics differentiated the Hall of Fame Career (such as that of Shaquille O’Neal) over the All NBA Career (such as that of Chris Webber). Model 1, using Linear Discriminant Analysis (LDA), was the best performing one. It utilized the statistics G, PTS, FT, TOV, BLK, TRB as the most telling predictors for a Hall of Fame career.
It is also important to note that these mathematical models do not take into account a player’s college career, international career, or even the number of NBA championships that they won as a player. These 3 factors are all important when considering whether or not a player is worthy of the Hall of Fame.
Be the first to comment on "How Can We Distinguish All NBA Caliber Players from Hall of Fame Worthy Players?"