Author: Walker Reinfeld (Weinberg ’20)
During the 2018 Major League Baseball season, New York Mets pitcher Jacob deGrom made the jump to be one of the best pitchers in the game.
Many baseball fans already knew about deGrom’s ability before last season from his showing during the 2014 MLB season, where he won the NL Rookie of the Year Award. He then followed up that performance with a trip to the World Series with the Mets in 2015, where he was an invaluable component to their pitching rotation. Even with this stellar resume early in his career, it seems last year deGrom went from being underrated to the top of the list of baseball’s pitchers. Just his ERA of 1.70 alone shows how dominant he was, and played a big role for him to win the NL Cy Young despite his 10-9 Win-Loss record.
With that, I decided to take a look at deGrom’s Statcast data that was acquired from Baseball Savant from every pitch that he threw from the 2015-2018 season in order to find out what made 2018 different.
The most important thing I found from my research was that deGrom had been a lot more consistent with his release point than he had been in years prior. As the graphic below shows, as his career progressed deGrom found a lower release point; however, it was not until 2018 when this release point became consistent across all of his pitches. This release point consistency could have helped deGrom in a couple of ways last season. The first is that it indicates that deGrom had easily repeatable mechanics last season. When a pitcher can repeat the same motion regardless of what pitch they are throwing, they can focus a lot more on the location of the pitch. It allows them to forget about the physical side of pitching and hone in on the mental side. Another benefit of the consistent release point is that deGrom now has the ability to easily deceive hitters. Major League hitters are pretty good at picking up even the smallest details that might give them a clue to what pitch is coming. This could be how long the pitcher manipulates the ball to find a grip, if they wiggle their glove hand fingers, or if their pitches come from a different release point. deGrom’s ability to deceive the hitter could have been a huge reason to why he was so dominant.
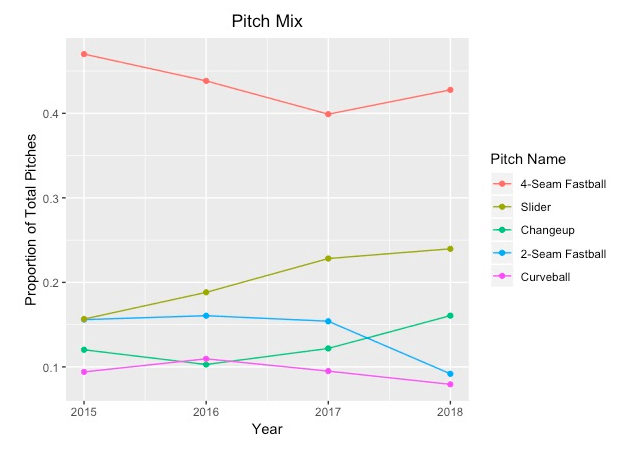
Another note about deGrom’s 2018 season is how he varied his pitches more than he did in previous years. In 2018, deGrom utilized his slider and his change-up more than he had in the past while relying on his curveball and 2-seam fastball less. His 4-seam fastball saw a slight increase in usage compared to the 2017 season, but it was still less than the 47% of the time he used the pitch in 2015. The ability to mix pitches in is integral to a pitcher’s success, as it can keep the hitters not knowing what pitch will be thrown next. In 2018, deGrom threw his 4-seam fastball 42.8% of the time, his slider 24% of the time, and his change-up 16.1% of the time. The mix of these three pitches also highlights another important factor of pitching: varying velocities. These three pitches all are thrown in three distinctly different speed ranges, the fastball, of course, being the fastest of the three, then the slider, followed by the change-up. This can have an effect again because if a player is expecting a fastball they will swing earlier. Now that deGrom has better control of his pitching, he has the ability to throw a change-up instead, causing them to swing too early and miss the pitch entirely! The more even distribution of deGrom’s pitch mix and pitch speeds could have also been a large part of his 2018 Cy Young campaign.
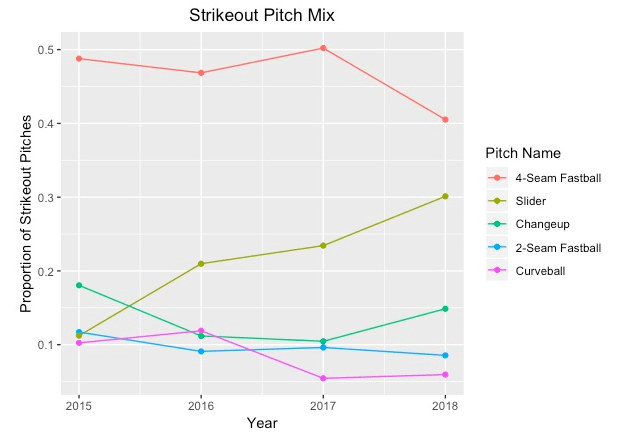
A similar chart below shows that deGrom trusted his slider and change-up more in strikeout situations. Pitchers never want to develop as “go-to” strikeout pitch as they can become predictable in important situations. deGrom’s improved ability to get strikeouts with pitches other than his fastball seems like another reason for his success.
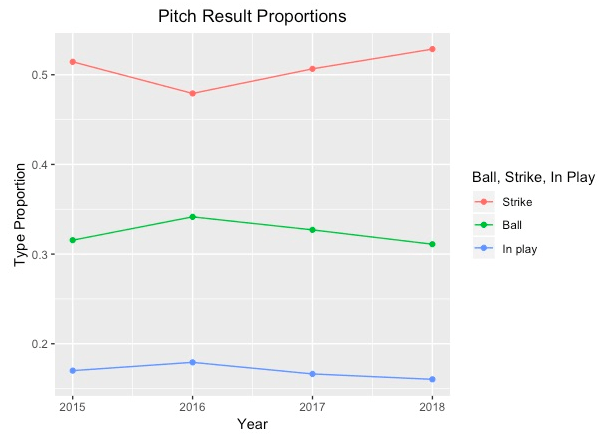
Lastly, it appears that deGrom improved on his command of the strike zone and limited balls hit in play during the 2018 season. This last graphic shows that in 2018 52.9% of deGrom’s pitches went for strikes and compared to 2017 his percentage of balls thrown dropped from 32.7% to 31.1%. Additionally, deGrom was able to only allow 16% of his pitches to be hit in play. deGrom’s improved ability to trust his pitches when he needs to throw strikes is a huge part of his game. One of deGrom’s calling cards is his ability to get out of tough situations. This graphic tells part of that story. deGrom is a strike thrower and has a great command of his pitches, which are partly why he was able to have that historic 1.70 ERA.
In addition, I looked at some physical attributes of his pitches like release speeds, spin rates, and effective velocities. All of these values had improvements from some point in deGrom’s career, but nothing came to be groundbreaking as to why he was so much better from 2017 to 2018. This is why I chose to highlight his season based on how he used those pitches rather than the quality of those pitches. Jacob deGrom’s 2019 season has not started off the way his 2018 ended, but you can see that he is not far off from returning to his 2018 Cy Young form.
Email walkerreinfeld2020@u.northwestern.edu.
DATA Citations
Daren Willman (2018): Jacob deGrom 2015 Pitch-by-Pitch Regular Season. Baseball Savant. https://atmlb.com/2G8hets
Daren Willman (2018): Jacob deGrom 2015 Pitch-by-Pitch Playoffs. Baseball Savant. https://atmlb.com/2SFYOBL
Daren Willman (2018): Jacob deGrom 2016 Pitch-by-Pitch. Baseball Savant. https://atmlb.com/2EbLscc
Daren Willman (2018): Jacob deGrom 2017 Pitch-by-Pitch. Baseball Savant. https://atmlb.com/2zTcWAv
Daren Willman (2018): Jacob deGrom 2018 Pitch-by-Pitch. Baseball Savant. https://atmlb.com/2PrflY8
Daren Willman (2018): Statcast Search CSV Documentation. Baseball Savant. https://baseballsavant.mlb.com/csv-docs


Be the first to comment on "A Graphical Look at Jacob deGrom’s Cy Young Season"