
Author: Wes Harrell (McCormick ’21)
Ever since I first started playing soccer my coaches would preach “they can’t score if we have the ball”. These words aren’t unique to soccer, they apply to any sport with turnovers, like football or basketball, but the notion of possession in soccer is far different form either of these sports. Whereas teams in football or basketball would prefer to keep possession of the ball for longer than their opponent, to someone watching soccer on TV for the first time it might appear that it’s the object of the game. But the object is to score more goals than the other team, it’s just that the seemingly universally agreed upon way to do this is by keeping the ball.
As I got older and kids became more technically skilled and athletic it became apparent to me that the better team didn’t always win, which is true of all sports, but especially in soccer. The best teams always had possession of the ball for most of the game, but I played plenty of games in which my team defended the entire game, got one breakaway, scored, and won. However, when I watched professional soccer it seemed that teams were almost always trying to keep the ball, even if they were clearly outmatched by their opponent. I asked myself, “why would a team try to play the same way as their opponent if they’re worse than them?”
A possession-oriented play style hinges on ball movement and creativity to break down defenses to score. When the team with more possession loses a game, it is usually because they couldn’t break down the opposition’s defense to score. A possession-oriented play style often produces a large quantity of chances, but can yield lower quality chances. On the other hand, a counterattacking play style commits more people to defense and then tries to break quickly after winning the ball back, taking advantage of the opposition having a lot of players committed forward. This counterattacking play style usually produces a smaller quantity of chances than a possession-oriented play style, but a higher quality of chances.
If two teams are both playing a possession-oriented style, the team with better players should usually win, so my hypothesis is that in a matchup with a clear better and worse team, the worse team should be playing a more counterattacking style more often than they currently do. Instead of pitting their worse players head to head against better players, the worse team should commit more players to defense, making it harder for the opponent to score, and try to counterattack at optimal moments in the game.
In the 2016-17 Barclays Premier League season, the average number of shots taken for the whole season was 486.7, with only 7.3 coming from counterattacks, only 1.5%. Counterattacks have to come from winning the ball back and the opponent having too many men committed forward, but this is still a surprisingly low percentage. The top 5 teams in percentage of shots converted to goals on the counterattack were: 60, 50, 50, 40, and 38.9. Those same 5 teams only converted 6.9, 8.6, 11.9, 9.6, and 13.9 percent, respectively, of their non-counterattacking shots into goals. Given the clear disparity in effectiveness between counterattacking and non-counterattacking shots and the fact that only 1.5% of shots taken were on the counter, it seems that in general teams should be trying to create more counterattacking opportunities.
In addition to this, I wanted to quantitatively analyze the relationship between possession and performance to see if it was actually as strong as the soccer world seems to think it is. To analyze the relationship between possession and performance, I compared the average possession percentage and total expected goal differential (xGD) for each team in the 5 major leagues in Europe, for each full season since 2014. Expected goal differential is the difference between expected goals for (xGF) and expected goals against (xGA). xGF measures the number of goals we would expect to be scored per shot with a number between 0 and 1. For example, a shot with .92 xGF means that we would expect that shot to result in a goal 92% of the time. xGF is calculated from a number of factors including: distance from goal, angle of the shot, whether the shot was kicked or headed, where the other players on field are, what the pass to the shot was like (short pass, cross, through ball, etc.), what passage of play the shot occurred in (open play, direct free kick, corner kick, etc.), and whether or not the shot was off a rebound. This stat is different from goals for (GF) which is just the number of goals actually scored. xGA is the same as xGF, just the goals the number of goals you would expect to be scored against a team. The reason I decided to use xGD instead of normal GD is that xGD is a better indicator of a team’s performance, because xGD accounts for randomness and luck that GD does not.
What I found was that there’s a relatively strong relationship between percentage of possession and xGD. The R2 value for the correlation is .6084.

However, as you look at the graph above, keep in mind that this data spans four years, meaning that teams that have stayed in the top league all four years have four data points. In fact, much of the correlation observed in this graph is created by a handful of dominant teams in the first quadrant, who consistently control possession and have the best xGD’s. A good example of one of these teams is Barcelona. Through the four years I analyzed, Barcelona never had an average possession percentage below 60% or a total xGD below 48.87. Barcelona is known worldwide for their beautiful tiki-taka possession but you must keep in mind that Barcelona has the best players in the world while other teams do not. This is a fairly obvious observation, but if Barcelona has the best of the best players, then maybe the same style of play wouldn’t work for every other run-of-the-mill team.
To explore just how much a handful of dominant teams were affecting the correlation between possession and performance, I removed the top 20 highest spending teams in the world from my data. The highest spending teams are the richest teams who can afford the best players in the world. Having the best players in the world allows a team to always out-possess their opponent, while also creating more and better chances. Besides, what I set out to find was whether the worst, not the best, teams in these 5 leagues should be counterattacking more instead of trying to play like their opponents.
The result of removing the 20 highest spending teams in the world was a correlation between percentage of possession and xGD less than half that of the one before. The R2 value for the correlation is .3019.
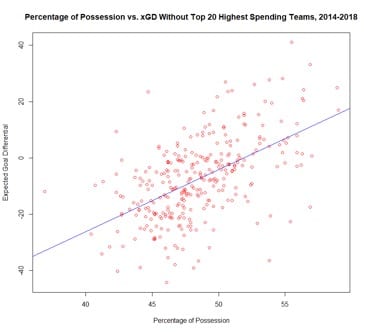
Without the big spenders there’s a relatively weak correlation between possession and performance. This graph still includes teams that are in very different financial positions with varying goals, from staying out of the relegation zone to Champions and Europa League qualification, so I believe the correlation could be even lower if I were to look at solely middle or bottom of the table teams. This weak correlation, paired with the underutilization and effectiveness of the counterattack tells me that more non-top tier teams should be counterattacking against teams that dominate possession.
Of course, not all teams are suited to counterattack. The main reason is that to successfully counterattack your attacking players must be very fast and you must have a ball-winning midfielder. Counterattacking also takes a very organized and disciplined defense, because you will be defending for most of the game. Teams must have strong leaders and everyone on the field needs to have high work ethic, strong focus, and high fitness to stay mentally engaged, in position, and able to quickly counter once the ball is won back. However, everything listed is either a physical or intangible trait. These are all coachable traits and it’s much more cost effective to buy players with strong intangibles or physical traits than to try to buy superior talent, which is what most teams try to do.
There are plenty of examples of teams who have already had great success counterattacking. During the 2015-16 season, Leicester City won the Barclays Premier League with only 44.7% possession per game, but a total xGD of 23.4. They had great speed going forward with Jamie Vardy and Riyad Mahrez, an industrious ball-winning midfielder in N’Golo Kante, and great leadership from Wes Morgan and Kasper Schmeichel, a central defender and goalkeeper. Another example is Atletico Madrid. Atletico is one of the top 20 biggest spenders in the world, but has never had more than 49% possession per game the past four seasons with 14.81, 29.32, 27.13, and 27.98 xGD from 2014-2018 respectively. This is the product of a world class defense with speedy wingers and Antoine Griezmann up top.
Possession has been engrained into the soccer world, because it’s the most attractive brand of soccer and the best teams do it. It makes sense that kids are taught from a young age to keep the ball, because this is how you improve technical ability, creating skilled players. But once you reach higher levels, especially professional, where the goal is to win, it does not make sense for two teams to try to possess the ball more than the other in the case that one team is clearly better than the other. Counterattacking puts a focus on defense, denying the opponent from getting high quality scoring chances, then picking the correct moments to attack once the ball is won back. Smaller clubs who aren’t competing to win leagues and don’t have the means to buy the best players would benefit greatly from tailoring their team to a counterattacking style of play.
Hi Wes. Great job with conceptualizing your hypothesis and articulating your results. Curious,any analysis, even simplistic of goal types: possession, counter attack,set pieces, possibly corners versus others. Are there general XGF by set piece locale and any heat map of those versus intuitive or “I watch a ton of football impressions” you have based upon your data set