
Author: Jake Mandel (Weinberg ’21)
Whether you’re a die-hard fantasy football fanatic or just an avid follower of the NFL, one of the biggest questions asked around the league is regarding how breakout rookies will perform in their sophomore season. This question has had drastic implications, especially for fantasy football, as names like Trent Richardson, Zac Stacy, Todd Gurley, and Thomas Rawls have haunted and disappointed owners in their second seasons in years past. The 2017 NFL season saw a number of strong rookie running back (RB) performances in players such as Kareem Hunt, Leonard Fournette, Alvin Kamara, and Christian McCaffrey, leaving curiosity about how these players will play in their second seasons. In order to develop insights into the nature of a potential sophomore slump for NFL RBs, I evaluated data on the rookie and sophomore seasons of “breakout” rookie RBs over the past 10 years (2007-2016).
In order to conduct such an analysis, I first had to identify the RBs to be used in my sample; that is, figure out who qualified as a breakout rookie RB. To evaluate the success of a RB’s season, I decided to use standard fantasy football points because the study I conducted is most applicable in fantasy football and I feel as though fantasy points are a very strong holistic measure of how a player performs in any given season. More specifically, I scrutinized each player’s position rank (PRK), which ranks a RB in fantasy points compared to other RBs for that season. I classified a breakout rookie RB season as a season in which a rookie RB ranked in the top 30 for PRK. I also sorted out any players who did not register at least 100 rushing attempts in their rookie season (to rid the data of any RBs whose success could be disproportionately attributed to work done as a receiver), or who did not play at least 12 games in their sophomore season (in attempt to control for injuries or suspension in impacting season long performance). Players such as Jahvid Best, Doug Martin, or Ezekiel Elliott had spectacular rookie seasons, but missed substantial time in their sophomore season and couldn’t be included in the data (even though Martin was abysmal in the games he did play in his second season). Further, one should recognize that there are many RBs such as Darren McFadden, Ray Rice, Lesean McCoy, and Melvin Gordon, who had a poor rookie season but broke out in their second year or a later season. These RBs were not included because I am strictly looking at what RBs achieved in their second year given that they had a great rookie season.
From 2007-2016, there were 27 RBs who filled this criteria, albeit no players from 2011. Despite this small sample size of players, I figured I could still draw some interesting insights about what a RB’s sophomore season might look like, given what he achieved in his rookie season.
To measure the comparative success of a RB in his second season to his first, I measured the change in PRK, which will be defined as PRKYear 2 – PRKYear 1. Shown below in Figure 1 is a box plot of the 27 RB’s change in PRK. The mean change in PRK for these RBs was -12.44, illustrating that on average, a RB fell 12.44 in PRK in their second season. One major concern with using this statistic is that all of the RBs were initially in the top 30 in their first season, so there is quite obviously a lot more room for decline than improvement. This may also just be the reality of why it is risky to take a second year running back, rather than a flaw in the metric. However, the median, which is very resistant to potential skewness, is -5, meaning that the player in the middle of the data experienced a drop in PRK of 5 in his second season. Keep in mind that the players who experienced an extreme drop in PRK were not afflicted by a serious injury or suspension, as all played at least 12 games in their sophomore seasons. The box plot indicates that around 75% of the players either stayed the same or declined in terms of PRK in their second season. Thus, the data suggests that a RB who finishes in the top 30 in PRK his rookie season tends to be more likely to experience a decrease in PRK his following season.

Clearly, there tends to be some sort of drop-off for Sophomore RBs. However, there are obviously multiple instances of RBs who had spectacular second seasons, such as Le’veon Bell and David Johnson more recently. So, I wanted learn more about who may be more likely to bust or thrive in year 2. I identified nine potential variables from a player’s rookie season that I figured may influence whether or not a player may be more likely to bust in their second season: draft pick number, PRK, receptions, rushing attempts, rushing yards, rushing yards/attempt, team wins, touchdowns, and 40-yard dash time. Creating scatterplots to identify a potential relation between these variables and a RB’s change in PRK, I noticed insights for plots including the variables PRK, rushing yards, rushing yards per attempt, team wins, and touchdowns, while the others did not seem to exhibit any meaningful features. These five scatterplots are shown below as Figure 2, Figure 3, Figure 4, Figure 5, and Figure 6, respectively. Note that these scatterplots only include 27 data points and merely illustrate the nature of a potential relationship among two variables; they should not be taken as causal or legitimate statistical tests.
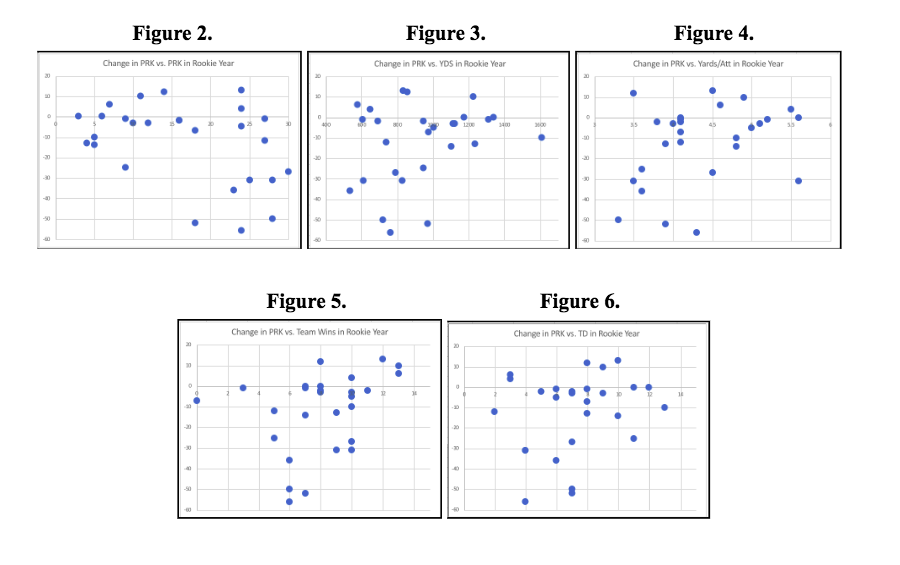
Starting with Figure 2, this plot attempts to look at whether or not how high or low a rookie finished in the top 30 will have any relationship to the change in PRK. There is clearly evidence of some heteroskedasticity in the plot, as the change in PRK became much more variable for players who finished between 17-30 in their rookie year. This might suggest that those who finish lower (closer to 30) in the top 30 their rookie year might be much more unpredictable in their second season, while those toward the higher end of the top 30 may tend to be less likely to experience a more extreme bust season. Moreover, there appears to be a slight negative association meaning that as PRK decreases (where decreasing means moving toward 30 and away from 0), change in PRK tends to decrease. Figure 3, which evaluates the relationship between change in PRK and rookie year rushing yards, exhibits similar qualities, as rookies with more than 1,000 rushing yards tended to stick much closer to their strong rookie year performance than did players with lower quantities of rushing yards. A slight positive association between rushing yards and change in PRK is exhibited. This similarity in Figure 2 and Figure 3 should probably be expected, as a higher PRK will typically come along with a higher amount of rushing yards.
Figure 4 is perhaps the most insightful plot, exhibiting a moderate positive association between rushing yards per attempt and change in PRK. With the exception of Thomas Rawls who averaged 5.6 yards per attempt his rookie year and fell 31 spots in PRK the next season, RBs who averaged 4.5 or more yards per carry in their rookie season tended to fare much better in their sophomore season than those who didn’t. Those with a higher yards per carry also appeared to be much more resistant to an extreme decline. Thus, it is possible that a RB’s efficiency (measured through yards/attempt) could be a strong indicator of continued success in the league. That is not to say that RBs with a lower average in their rookie season will automatically bust, just that they appear to be more likely to do so. A similar but weaker trend is portrayed in Figure 6, as touchdowns and change in PRK appear to be positively related, with players scoring more touchdowns in their rookie season also tending to be less likely to heavily decline in year 2. A potential explanation for this finding may be that a player who scored more touchdowns is often used more in the red zone and is probably valued highly by the team, which may lead to more consistent usage and opportunities for the player in his second year.
Lastly, Figure 5, which plots team wins and change in PRK, portrays a very slight positive relationship between the two variables. Even though there were only three rookies whose teams won 12 or more games, it is worth noting that all three of these RBs experienced better sophomore seasons. On the other hand, the players whose teams won 4 to 11 games had much more variability, and it is difficult to draw any meaningful conclusions for that range.
Overall, there seems to be a general tendency for second year RBs to decline, although this is not always the case. In trying to mitigate the risk of selecting a RB who will bust in year 2, I have identified 5 relatively significant criteria regarding the RB’s rookie year: having a PRK in the top half of the top 30, a relatively high number of rushing yards, a relatively higher yards per rush attempt, a high number of team wins (although if this number is not 12 or higher, the data suggests it may not be important), and a relatively high number of touchdowns. Even a RB who fulfills all of these criteria will not automatically have a strong season, but will likely have a much lower probability of busting based on historical data.
Looking at RBs who will enter their second season in 2018, owners should be wary that there is a high risk these players won’t live up to high expectations set after a strong first season. However, Kareem Hunt tallied over 1,300 rushing yards with a 4.9 yards per attempt average and 8 touchdowns, while Alvin Kamara had a yards per attempt average of 6.1 and also scored 8 touchdowns. This suggests they could be safer picks out of the sophomore RBs. Further, despite a low yards per carry for Leonard Fournette, he racked up over 1,000 yards and 9 touchdowns, indicating he could also be at a lesser risk of busting next season. On the other hand, Christian McCaffrey’s underwhelmingly low 437 yards, 3.7 yards/attempt, and 2 touchdowns on the ground could be a warning sign for 2018. However, there are certainly a large number of nuances from team to team and player to player that influence a player’s second season and weren’t accounted for in this analysis such as changes in a team’s coaching staff, depth chart, or the performance of teammates, so only time will tell how these players fare in their second season.
Sources
“Pro Football Statistics and History.” Pro Football Reference, Sports Reference LLC, 2018, www.pro-football-reference.com/.
Be the first to comment on "Determining the Existence of a Sophomore Slump for NFL RBs and Identifying Potential Risk Factors"