We found that there was significant pricing inefficiency amongst teams, with a significant negative correlation between regular season wins and average Pts/$K. To perform this analysis, we used our filtered data to analyze the performance of every player on every team and computed the average Pts/$K for all teams throughout the regular season.

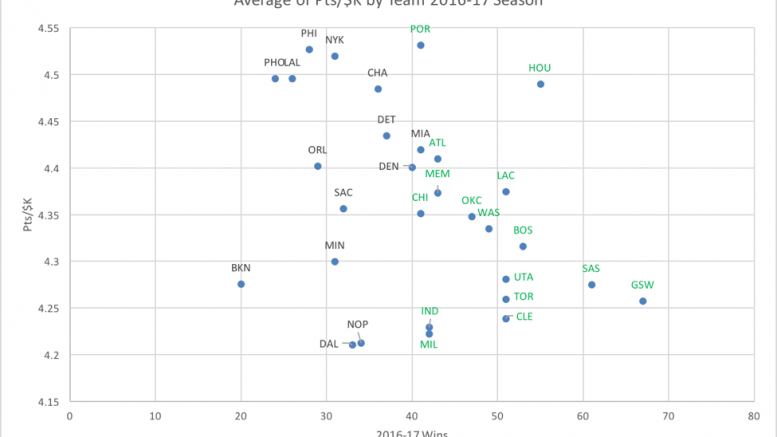
Scatter plot for teams based on their pricing efficiency (green teams are playoff teams)
The average Pts/$K for all players throughout the 2016-17 NBA season was 4.363. Interestingly, we see that better teams seem to have lower average Pts/$K. Why is this?
Theory 1: The best teams often win blowouts where great players sit during at least some portion of the 4th quarter (allowing many bench guys to come in and spread the wealth of total points accumulated).
Theory 2: The players are inherently overpriced and the public is biased towards the better teams when selecting players (Stephen Curry is a sexier pick than Eric Bledsoe). While the FanDuel pricing strategy and algorithm are unknown outside the company, we know that one component of their strategy is to increase a player’s price over time when that player appears in a sufficiently large proportion of lineups across contests. Thus, it is conceivable that as a result of high public demand to draft the players from better teams (teams that are on TV more often, and receive more publicity in the media), they become overpriced over time.
Clustering Teams

The vertical yellow line at 41 wins separates the playoff teams from the non-playoff teams (except for Portland, which missed the playoffs). The purple “regression” is not accurate as a formal regression line but was eyeballed. The bottom left cluster consists of 5 teams with under 35 wins, and below 4.4 Pts/$K. The bottom right cluster consists of 13 teams who all made the playoffs and averaged below 4.4 Pts/$K. The top left cluster has 9 non-playoff teams who all averaged greater than 4.4 Pts/$K. Finally, we see the top right cluster (the smallest), consists of only 3 teams with greater than 41 wins, and greater than 4.4 Pts/$K.
We see there is widespread inefficiency in the pricing of teams, not just the better teams. Of the non-playoff teams, nearly two-thirds (9/14) are at or above 4.4 Pts/$K. Of the playoff teams, over three-fourths (13/16) are below 4.4 Pts/$K. The Portland Trailblazers had the highest Pts/$K at 4.53. The Dallas Mavericks had the lowest Pts/$K at 4.21.
Linear Regression

We ran a simple linear regression, using Pts/$K as the dependent variable, and wins as the independent variable. We found there to be a significant negative correlation at the 0.1 level.
Concluding Insights
When in doubt, it makes sense to pick the player from the worse team – there is a higher probability that players from the Phoenix Suns are underpriced, while the San Antonio Spurs players are more likely to be overpriced.
Be sure to check out Blog #2: Finding Inefficiencies in NBA FanDuel Pricing – Phoenix Suns (coming February 5th)
really interesting topic and im more than happy to learn more about it. Do you have a more detailed version of this article?