|By JD Cook & Michael Fedell|
INTRODUCTION
This study began with a project in our Everything Starts with Data course (MSiA 400) which meant to cover a wide survey of important topics in data science. To gain practical experience, the class was divided into project groups and given some messy, real world data with a business problem to solve. Our team was tasked with analyzing a large collection of data from US job postings. The data will be described in further detail later in this article, but the primary objective was to use the information contained in job postings (keywords, salaries, titles, etc) to define a metric for measuring job demand, and uncover trends and insights in the job market. As this presented a rather large volume of work, the data was further broken into segments by industry. While our group of 5 analysts tackled data from the Information and Technology sector, other groups covered Healthcare, Manufacturing, and Construction. After 6 weeks of work, we focused on integrating our results and insights, and packaging the analysis into a user-friendly application for further exploration.
Please open the application and feel free to explore as you read through this article.
Case Background
Client
Greenwich.HR (https://greenwich.hr/) is a labor market intelligence firm who seeks to connect investment managers, employers, recruiters, and business intelligence teams to valuable, real-time insights pulled from job market data. Their mission is to make it easier to understand what is happening in the job market by providing comprehensible, real-time, accurate, and accessible data. APAC Business Magazine recently recognized Greenwich as the leading global provider of labor market intelligence.
Problem
Demand in the job market can be defined in many different ways; common measures include scarcity, impact, sheer volume, and many others. Because of this, demand metrics are similarly difficult to nail down. Greenwich provided our team at MSiA with a sample of their data in an effort to spur innovation surrounding how demand might be defined and measured. While we wanted to take a creative, open-ended approach, some sample questions included:
- How should demand be defined?
- What metrics define high demand jobs?
- How does demand vary across markets?
- How are skills shaping demand?
- What are the key skills that are driving the highest demand for selected jobs?
- How do these drivers of demand vary across markets?
These open-ended questions gave our team the latitude to explore the data without preconceived notions of what we should be looking for – leading us to several creative solutions.
Novel Solution
Typically, demand is defined and measured as the number of jobs available for a given role over time. In order to elucidate new and interesting results, we decided to take a different route. Rather than viewing demand as a function of availability or time, we analyzed demand as a function of skills. By our definition and custom metric, a job in high demand is characterized by skills that are also required in many other jobs. In essence, we are evaluating demand on the skill-set required within role.
This viewpoint on demand actually puts job roles on a spectrum from generic to specialized. On one end (high demand for skills) you find jobs which are defined by skills that transfer between roles, while on the other end (low demand for skills), you have niche jobs which require specialized skills that aren’t as easily transferable.
This may be considered an untraditional way of characterizing demand, especially by the fact that in our definition, a role with high demand for skills doesn’t mean that there are lots of jobs available in that role, it just means that the skills required for that role are demanded in more roles. Thus, availability of roles is not a consideration. However, an individual working in a high-demand job should be able to easily find work due to the transferability of their characteristic skills.
As we will discuss in the Results section, focusing our view of the job market on required skills brings interesting findings to light that may be valuable to HR consultants, employers, and prospective employees.
Dataset
The data used in this project are part of a proprietary collection of job postings collected by Greenwich.HR to serve their diverse client base. At a high level, the available data describes more than 18 million open job postings across the United States over the course of a year and a half. These data covered over 700 thousand companies in the IT, Healthcare, Manufacturing, and Construction industries and included details such as job posting keywords, date posted, date filled, official title, estimated salary, and company name and location. The completeness of data varied by industry; for example, the Healthcare postings had very robust information on time to fill a posting, while the IT dataset was most rich in its job keyword details (referred to henceforth as “tags”). One issue that presented itself early on in the analysis was industry-ambiguity for certain roles. For instance, a “System Administrator” may be listed under “Healthcare” as many hospitals hire for that role; however, a SysAd is generally seen as IT personnel and thus each job posting was reclassified to the industry in which that job’s title was most common.
Methods
Top Skills For Each Role
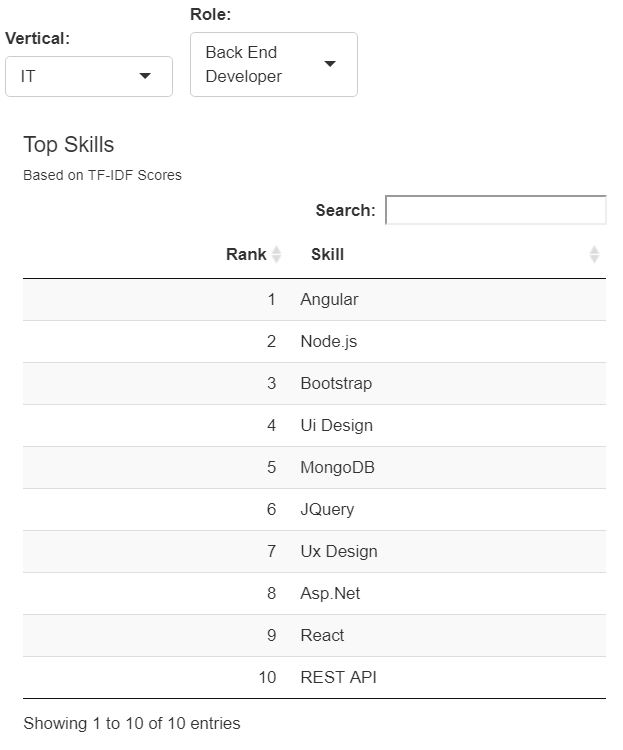
First, in order to build a demand metric for roles based on skills, we had to determine which skills were most characteristic of a given role. The problem that we face in the data is each role has many skills that are very generic such as communication, organization, time management, etc. While these skills may be important, they don’t necessarily help set a given role apart from others. To overcome this problem, we utilized TF-IDF (Term Frequency – Inverse Document Frequency) to identify the skills which are most pertinent & unique to each role.
We treated all job postings as a corpus, and the lists of tags (skills) for each role as documents. Doing so allowed us to determine which skills were most frequent within a role (term frequency), but also most infrequent across other roles (inverse document frequency).
The result of the TF-IDF analysis was a list of skills for each role, sorted by the TF-IDF score (more important skills at the top). In an effort to condense the analysis and ensure we were looking at only the most important skills, we only used the top 10 skills for each role. Figure 1 below shows the output as seen in the dashboard:
Roles by Skill-Demand Metric
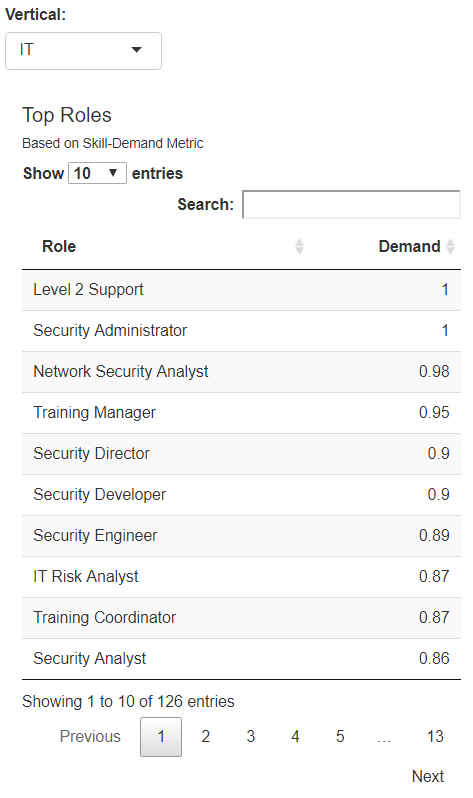
Now, with skills sorted within a role using TF-IDF, how do we move outwards and sort roles within a vertical by demand? Our custom, skills-based demand metric arose from this question. As a review:
By our definition and custom metric, a job in high demand is characterized by skills that are also required in many other jobs. In essence, we are evaluating demand on the skill-set required within a role.
Using the top 10 skills for each role, weights for each skill were derived by dividing the number of appearances of that skill by the total number of skills (repeats allowed) in the data. In essence, we are weighting each skill by the proportion of times it shows up in the data. The top 10 skill weights are then summed up for each role, leaving us with a final score for each role.
From here, we scale the final scores to a range of (0, 1), with roles closer to 1 being in higher demand (skillset-demand), and roles closer to 0 being in lower demand. The new scale considerably improves interpretability. Figure 2 provides an example of the final output as seen in the dashboard:
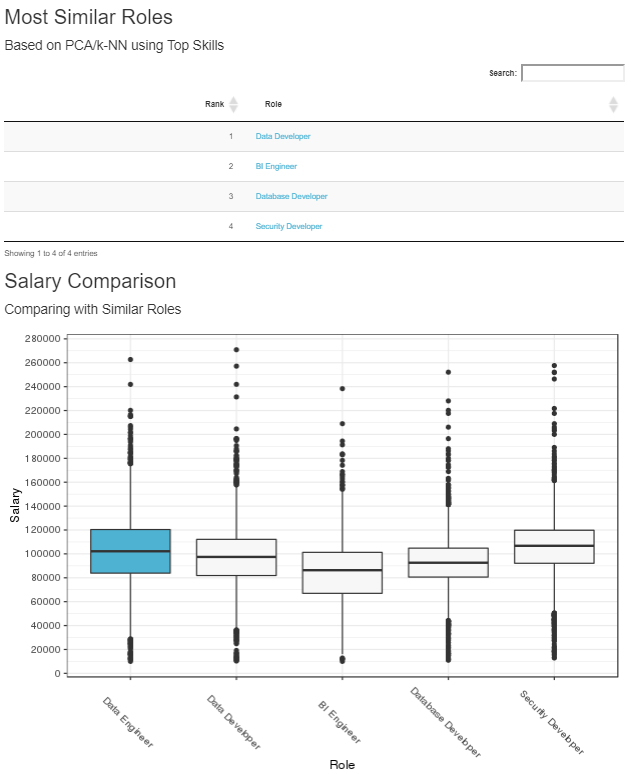
Role Nearest Neighbors + Salary Comparison
After evaluating various roles based on skill set relationships, we decided it would be interesting and valuable to uncover what roles are most alike, and how their salaries differ. At this point, we were working with a dataset of 165 roles x 274 skills. We utilized one-hot encoding to mark each role with its top 10 skills, but rather than just using 1’s, we planted the TF-IDF value for each skill in the data. The resulting dataset included a row for every role with a maximum of 10 values in each row corresponding to the TF-IDF score for the top ten skills. However, we can see an immediate problem with this dataset: at this point we have nearly twice as many skills (predictors) than we did roles (observations). In order to perform K-Nearest Neighbors analysis to determine the most similar roles based on skill-set, we needed to first reduce the dimension of our space (fewer skills).
Principal Component Analysis (PCA) is a dimensionality-reduction method that takes potentially correlated variables, and performs a transformation to create a set of fewer uncorrelated variables. In other words, groups of related variables are collapsed down into a single, uncorrelated “principal component”. The goal is to capture as much of the original variation as possible while still reducing the dimension.
We first tested dropping the dimensions of the skills to 150 components via PCA in order to get the dimensions lower than the number of observations. We noticed, however, that the incremental amount of variance explained past ~100 components was marginal, thus we decided to condense the number of components to 100.

Now, with the same number of roles (165), and a lower dimension of skills (100 components), we were ready to perform K-Nearest Neighbors to find the roles with the most similar skill-sets for each role.
K-Nearest Neighbors is a non-parametric approach that, for a given observation, finds the nearest “K” observations according to some distance metric across the all dimensions of the data. In determining “K”, we felt like the most important consideration was helpfulness to the end user, so we went with 5. Using the results of the K-NN analysis, we provide the most similar roles, along with a salary comparison of those roles for the end user as seen in Figure 4:

Role and Skill Counts by Vertical
In an effort to enhance the final deliverables, as well as provide a reference to the end user, we also performed simple counts analysis for both roles and skills within a given vertical as illustrated in Figure 5.

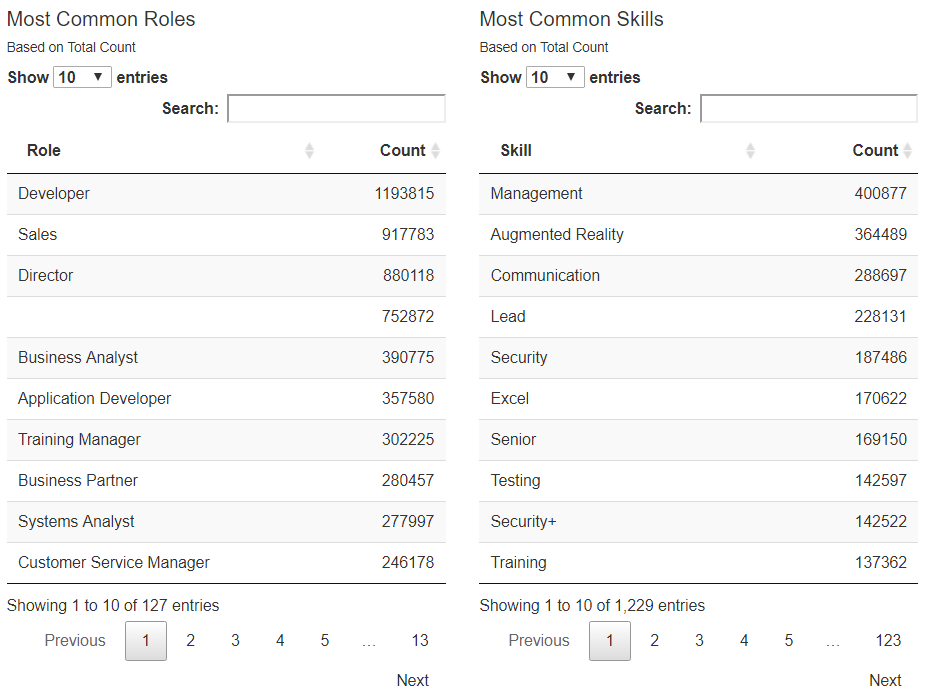
These tables are a smaller picture of the traditional way that we view demand, e.g. by sheer quantity hired during a specific time frame.
Each of these methods were directly incorporated in the dashboard.
Results
Deliverables
The key insights from this project were delivered via an interactive dashboard built with R Shiny to facilitate analysis of the job posting data with which Greenwich operates. This dashboard is designed with three specific user archetypes in mind: HR Consultants (Greenwich), Employers (Greenwich clients), and Prospective Employees. We focused our work around answering important questions that each of these user groups may want to ask of the data.
Use Cases
We wanted to facilitate analysis on this rather large and opaque dataset with specific user groups in mind. To help said users get acclimated to the tool and to highlight some of the key features/insights, we prepared several use cases.
HR Consultant:
HR Consultants are charged with the difficult task of understanding a highly mercurial and nebulous job market and drawing out real-time insights for their clients to act on. They must answer the question of “what is going on in the job market today?” The HR Consultant can leverage this tool to gain a better understanding of the job market as a whole. When working with clients or seeking new engagements, it is key to communicate expertise and specific domain knowledge. By studying the most common and most demanded roles highlighted in this application, they will be able to better serve clients.
- Top Roles: consultants could use the top roles table (Figure 2), which utilizes the novel skill-demand metric, in order to explore which roles are generic in nature, and which roles are more niche.
- Most Common Roles & Skills: tables based purely on counts in the data give a sense of magnitude for each role and skill in the market, which can signal movements in the job market
- Similar Roles: viewing similar roles and their attending salaries can aid a consultant in understanding natural cross-role career progressions
Employer:
Employers have to answer the key question of “how should I post this job” in order to attract strong talent in a timely fashion. In today’s increasingly competitive job market, it is more important than ever for employer’s to communicate thoroughly and effectively to potential candidates. The following details may be of particular interest to employers:
- Role Title: many companies may be hiring for the same essential role, but using a different title. Because this is typically the number one driver of employee job searches, it’s important to use the right terminology here.
- Skills to enumerate: another first stop for potential candidates is the list of keywords associated with a job. Once a company qualitatively describes a job, they must also use the proper keywords and skill tags to drive searches and give the candidate a summary of the required qualifications and skills.
- Lastly, employers could use this tool as a means to benchmark their salary offering against the “fair market price” for similar roles.
Prospective Employee:
Job hunters will also be interested in the insights this application has to offer as it can help drive, refine, and inform their job search. Job candidates face the question of “what kind of work is out there for me?” It’s no secret that people today are working shorter terms on average and moving firms more often than workers of previous generations. This tool can help job hunters find not only similar roles to their current job, but also new roles that may be a good fit for their skills, or even to shed light on less similar jobs that they may be interested in. In particular, the following features may be particularly useful for hopeful employees:
- Similar Roles: a particular role is defined by a set of skills and qualities and can thus be easily compared to other roles. By this means, an employee can find other jobs which match their current job qualifications.
- Key Skills: conversely, if a candidate is interested in working in a particular space or job function, they can easily ascertain what are the key skills needed for that job and then refine their personal development accordingly.
- Salaries: lastly, a candidate can periodically reference the salaries and similar roles tool to compare their salary to other workers in the same role across the industry, as well as roles which leverage a similar skillset.
Insights
Job demand is inherently difficult to define and thus quantify from job posting data. Naive measurements may look at raw number of job postings for a role, or even change over time in number of postings. However, this fails to capture the specialized or niche roles which are also highly demanded. Though there are many ways to define demand for a job, we found an interesting definition in the comparison of a job’s required skills relative to other jobs in that industry. Below, we present a few interesting insights that resulted from exploring our own interactive dashboard:
Information Technology
- The most highly demanded role in the IT industry is a Security Administrator
- In fact, 6 of the 10 most demanded roles in IT are related to security.
- Data Scientists take ownership of ML, NLP, Hadoop, Statistics, and other related skills and earn higher average salaries than Data Developers or Data Engineers.
Construction
- The most highly demanded roles in the construction industry include painters, electricians, roofers, and plumbers
- Even the most highly demanded roles are paid significantly less than those of the IT vertical
- Journeyman roles are among the most common in these postings
- Electricians are typically the most highly compensated in this industry
Manufacturing
- Line Workers, Machine Workers, Warehouse Workers, and Forklift Operators are among the leading jobs in this industry
- Assembly Workers can make nearly $10k more upon promotion to Assembly Supervisor and another $10k upon promotion Production Supervisor (all with nearly identical skillset)
- Pipeline Managers are considered very niche, but fall high on the earnings scale at around $90k/year
Healthcare
- Nurses dominate the demand in this industry (5 of top 6)
- We find Reproductive Endocrinologists at the bottom of the list (most niche)
- Home Health Nurse is the most demanded role, yet its closest counterpart (Home Health Aid) is ranked 39 in the list, and paid on average $25k less per year
Reflection
For many of us, this project presented our first exposure to “analytics in the wild” and taught us much about working with a client’s needs in mind, centering our analysis on business value, and moving from ambiguous questions to focused objectives. Something we later found upon making refinements to the dashboard application was how defining use cases and seeking to better understand our audience helped to direct and guide our development. Additionally, we learned the importance of defining and documenting your assumptions, goals, and planned work before setting out on any one path. Lastly, this project taught us how to think creatively and look beyond the most common tools in our kit, to explore foreign technologies/methodologies with confidence, and to iterate quickly as we seek to derive business value from large datasets.
Acknowledgements
We would like to thank…
Cary Sparrow, CEO of Greenwich.HR, for special insight and feedback, domain expertise, and being incredibly accommodating as a partner.
Dr. Diego Klabjan for facilitating the project and providing strategic guidance.
Dr. Borchuluun Yadamsuren for coordinating our research efforts, as well as providing review and revisions.
Northwestern University - Using Skills To Define and Measure Job Demand | Greenwich.HR
August 1, 2019 at 4:53 pm[…] https://sites.northwestern.edu/msia/2019/08/01/using-skills-to-define-and-measure-job-demand/ […]