|By Marcus Thuillier|
ELOR Rating System
Introduction
Ever since I was little, rugby has been my favorite sport. Rugby is still a developing sport in the USA, but the national team has been in every World Cup, but one and is now solidly entrenched as a top 15 team in the world. Rugby rules and scoring are similar to American Football’s, and some players even switch between the two (Nate Ebner, for example, was both an NFL player for the Patriots and a rugby player for the USA Rugby 7’s team). Something I was always fascinated with was how much of an NFL game was quantifiable with stats. You could get favorites, pre-game odds, in-game odds, etc. World Rugby rankings could not do that (except for giving you the ranking from 0 to 100 before the game), and it left me wanting for a more comprehensive ranking system that could be used in more dynamic ways. For example, on October 6th, 2018, New Zealand (the number one team in the world) came back from 17 points down to beat South Africa in just 20 minutes of playing time. In the world of Rugby Union, this kind of result is rare. I was eager for a way to quantify just how surprising this result was. Since the world rugby ranking system has never been used in order to do this, I settled on the ELO rating system, which allows, amongst other things, for in-game win probability adjustments and would be good to evaluate how daunting this comeback really was. Let’s dive right into it.
Background
Dr. Arpad Elo developed ELO in the 1950s to rank chess players. Since then, ELO has most notably been adapted to the National Basketball Association and National Football League by the journalists of the website FiveThirtyEight. A version for world soccer also exists on eloratings.net. I will be looking to develop an ELO Rating for Rugby (ELO-Rugby, or ELOR) and will use NFL ELO Ratings as a reference, for a couple of reasons: a) Rugby Union and American football scoring is relatively similar: seven points for a touchdown / converted try, three points for a field goal / penalty kick (this makes it easier when building the model to look at margin of victory for example and helps in determining a conversion between points and ELO score) and b) NFL teams play between 16 and 19 (if they go all the way to the Super Bowl) games per season, and most major rugby union teams participate in between 10 and 15 games per season. The similarities make the NFL ELO system a good starting point, but some tweaks and changes need to be implemented.
The ELOR Rating: Theory
The ELOR rating will take into account all game results since the year 1890 for rugby, available via the website stats.espnscrum.com. This start date was selected because that is the earliest for which we have game results with modern point scoring. Once all these games are accounted for, the ELOR Rating will be calculated as follows:

R’ is the new Rating
Rold is the old Rating
ELOold and ELOaway are the home and away ELOR ratings.
corrcoeff is the “auto correlation adjustment multiplier” used to deal with autocorrelation.
margincoeff is the margin coefficient. If only the margin were used, games between the top team New Zealand and a team like Portugal would weigh way too heavily into the rating. With this coefficient, those big blowouts are capped in their weight based on a logarithmic scale.
Those two coefficients could use some tinkering when developing the model further. For now, though, the two coefficients will be the same as those used by FiveThirtyEight for their NFL model. Those values are:

W is 1 for a home win, .5 for a draw and 0 for a home loss. Those values are used in most ELO models, and they allow you to compare the actual result with the predicted result, which is a probability between 0 and 1.
In W*, the Win Expectancy, the diff is calculated by the difference in rating plus a home field advantage constant.
The Brier Score is commonly used to measure the accuracy of binary probabilistic forecasts, in fields like meteorology and recently in sports analytics. I used the Brier Score to optimize the model and determine the K factor and home-field advantage. The Brier Score is calculated as follows:

The lower the Brier Score, the better the accuracy of the ELOR model.
The Home Field advantage (x-axis) has been optimized for the model, in conjunction with the K-Factor (five different colors for 10, 20, 30, 40 and 50) in the following two graphs. The Brier Score is on the y-axis. After finding that values around K=40 had the lowest Brier Score across the board (Figure 4), I focused on just those values in Figure 5.


Following these tests, I chose to go with a home advantage of 75 ELO points and a relatively high K coefficient value of 40 (which gave the lowest Brier Score), leading to a quicker response from the model to the new game result.
Limitations of my ELOR
Several limitations I noticed or notes I made when building my ELOR model:
1. The top 10 teams in the world, the so-called Tier I teams, have ruled World Rugby since it turned professional in 1995: they have better infrastructures, more regular matches, compete in the two Tier I tournaments each year and are present in almost all semi-finals and quarterfinals of World Cups. Those teams are in no specific order: New Zealand, Australia, and South Africa in the Southern Hemisphere (the founding members of the Tri-Nations in 1996), France, England, Scotland, Wales, Ireland in the Northern Hemisphere (who disputed the Five Nations up until 1999). Argentina and Italy were added, as they regularly play these teams in the now Rugby Championship (which followed the Tri-Nations) and Six Nations (which followed the Five Nations). It is hard to compensate for the fact that there is little to no interaction between teams in Tier I and all the other teams outside of World Cups. In further iterations of the models, a way to account for some of the model’s overestimation of highly successful Tier II teams (any of Georgia, Portugal, Romania, Russia, Spain, Canada, USA, Uruguay, Namibia, Japan, Fiji, Samoa and Tonga) that barely play against Tier I teams could be implemented. An option I am considering for a further iteration of the model that I want to develop before next year’s World Cup is to weigh down the rankings of Tier II nations when they play Tier I nations, but for now, it will not be changed.
2. Some teams do not play much, especially before the 2000s. For the Tier I teams, they usually play 4 or 6 games in the Six Nations (Northern Hemisphere), and Rugby Championship (Southern Hemisphere), 3 or 4 games in the June international matches and 3 or 4 matches in the November matches. Most teams play less than that or play games at less than full strength (due to conflicting club schedules for teams like Fiji and Tonga for example). This means that some teams will have high volatility in their rankings, something the ELOR has issues with as it is perfected with increased sample size. That is a significant difference with the models for the NBA and NFL, where each team plays the same amount of games each season (excepting playoffs) and have all their players available during the season (barring injuries). This is further aggravated by the fact that some data for some games appear to be missing from the dataset and is difficult to account for.
3. Teams like Argentina sometimes field a B team to their national team. For Argentina, that team is Argentina A or Argentina XV, and they mostly compete against teams in the Americas Rugby Championship and Nations Cup. The Argentina A team is made up mostly of players from the local club league (as opposed to pro players in the Argentina team who play in the Super Rugby, the club championship for the Southern Hemisphere teams) and is still written as “Argentina” in the dataset, which would help teams like Uruguay, the USA or Georgia in case of victory against that “Tier I” team. It could be considered in future iterations of the model to differentiate A and B teams, but it is difficult to check team compositions for each match to determine that.
Those three issues will come up in the ELOR ranking. The ELOR could be updated in further iterations to correct for those three issues. I have tried to address them in the way I calculated the ELOR, like with the balancing of missing games in the dataset by higher K-factor, but especially for volatility with Tier II teams and Tier III teams (all others), it is just a factor that is inherent to world rugby that has to be kept in mind when looking at the rankings.
Implementing ELOR
The ELOR is established in a series of python codes, with visualizations done in both R and Tableau. The Python code first scraps the data from the ESPN website using BeautifulSoup. The ELOR then is initialized, 1500 for all teams. A following code is then used to update the ELOR based on each game result and according to the original ELO formula mentioned above. Finally, a final code is used to analyze the results of the ELOR predictions.
Results
For comparisons, here are the top 25 teams in World Rugby rankings and ELOR ratings as of November 26, 2018.
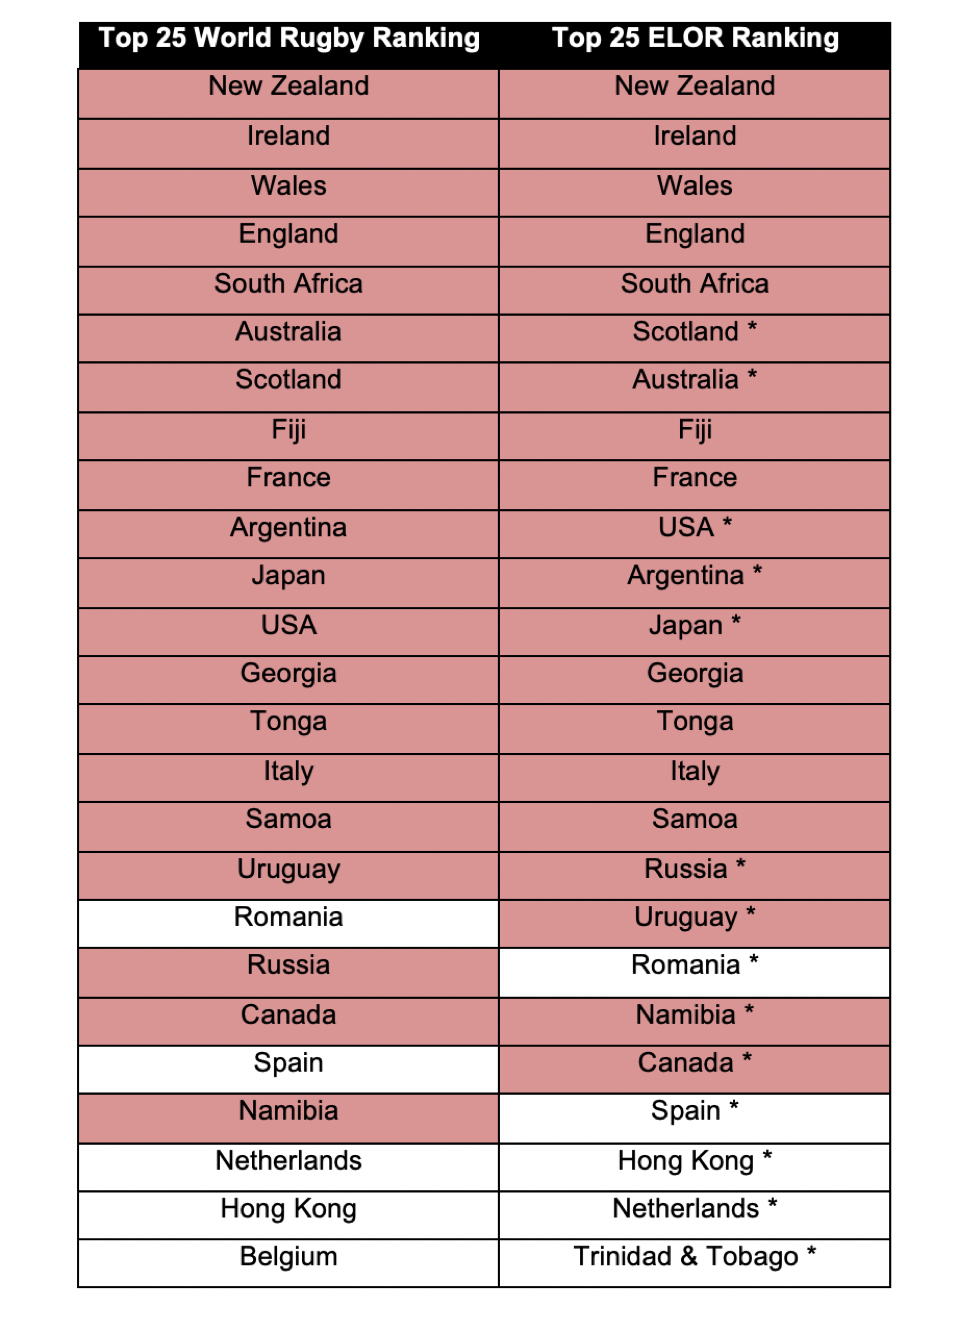
(teams highlighted in red are qualified for the 2019 Rugby World Cup, teams with a star show a difference in the ELOR Ranking)
A few observations: Fiji, after beating tier I team France during November’s international
matches, jumps to eighth both in the world ranking and the ELOR rankings. The first surprise comes from the USA’s place at number 10 in the ELOR ranking (12th per Rugby World), but it has to be considered that they had an excellent 2018 year, losing only against Ireland and the Maori All Blacks, and beating Scotland and Argentina XV (which counts as “Argentina” in the dataset) this season. The second surprise is that Italy, despite a convincing victory over Georgia in the November international matches, barely appears in ELOR’s top 15 after consistently playing and losing to better Tier I teams (notably not winning any games in the Six Nations in the past three years). This is however in line with World Rugby Rankings.
Otherwise, the rankings are fairly consistent (although past position fifteen, most teams have a star indicating a difference between the two rankings, but they are mostly within one or two positions of difference). The ELOR was also an improvement over world rugby rankings as it had all 20 teams qualified for next year’s World Cup in its top 21 teams (highlighted in red), the other team being Romania (who originally qualified but got sanctioned for fielding ineligible players) at 19. Canada, the last team to qualify for the World Cup, shows up at 21 in the ELOR ranking. World rugby’s ranking has the last qualified team for the World Cup, Namibia, at 22 in its ranking.
The ELOR Ranking provides another significant improvement over the World Rugby Ranking. Where the World Rugby Rankings published its first edition in September of 2003, in time for the 2003 Rugby World Cup, the ELOR Ranking is updated since the first game played in 1890. Now, the ELOR needs teams to play many games to improve accuracy and so the earliest ratings will probably not be too accurate. However, one can expect the ELOR to be a reliable ranking system for teams as soon as they reach upwards of 20 to 30 international test matches played. The ranking will always be more accurate in recent years, as teams play more matches and have over 100 years of history that is taken into account, but ELOR realistically allows for Rugby Rankings to be calculated as far back as the early 20th century, which is a sizeable improvement over the World Rugby Rankings that has only been in place for the past 15 years. This is implemented in an R code that demands user input for a date and outputs the ELOR ranking at that date in time, all the way back to 1890.
On top of creating rankings, ELORs huge advantage is that it allows for pregame and in-game predictions. The pregame win probability is based on the probability formula mentioned in the “The ELOR Rating: Theory” part (calculation of Win Expectancy). The in-game prediction is calculated as follows:

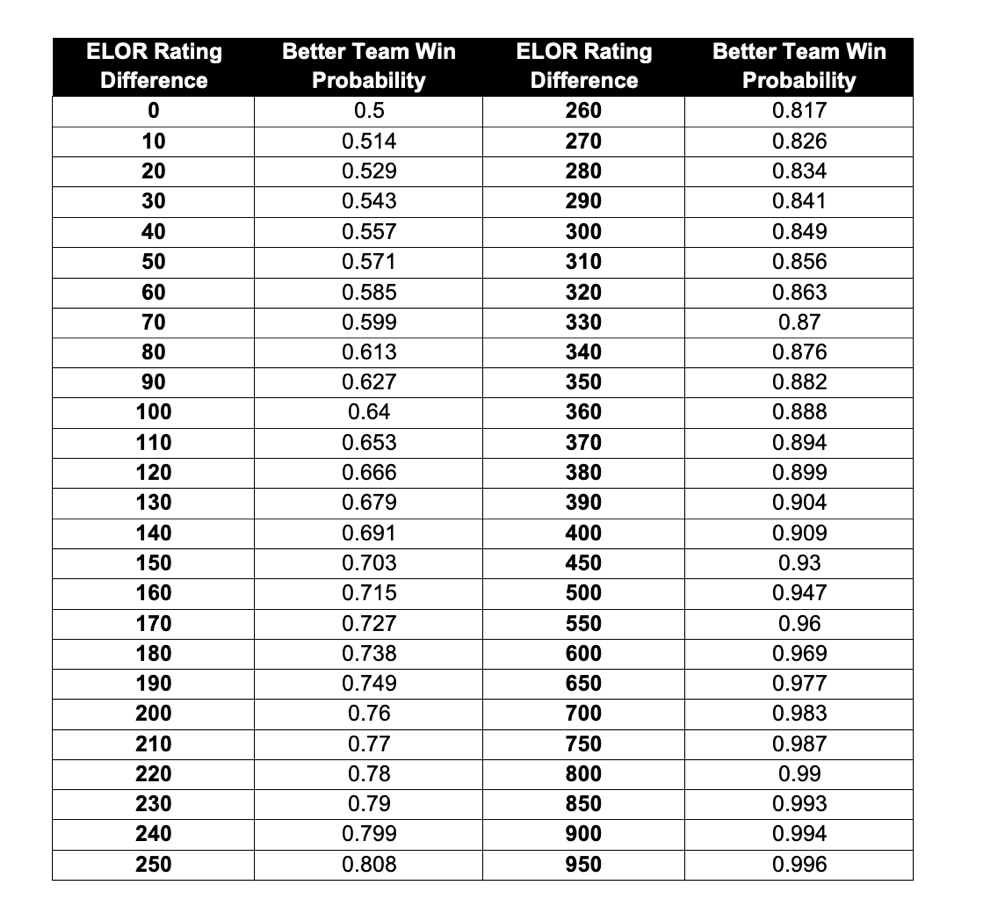
After running ELOR, the following tables for pregame predictions were output:
As I inched closer to the conclusion of this project, I only needed one thing to determine in-game probabilities. I needed bookmaker odds for the games. However, gambling on international rugby is not very widespread, so I lacked in sample size. I used some of the lines I could find and matched them up with the pregame ELO rating difference between the teams. I then fit a quadratic equation for best fit, but it is a very loose estimate. Interpret the point-spread predictions as a simple estimate of winning margin, that loosely fits bookmaker odds. It can be used to determine in-game probabilities for now and will be refined further when I can find more odds or with the help of historical data. In the next iteration of the ELOR model, I will look at historical results and margins of victories to determine a better equation to find game odds. For now, however, the results are interpreted based on the following equation:

75 ELO points, which corresponds to the home field advantage, procures about a 5.75-points boost based on historical data (average margin of victory for home teams since 1890) and is added as another data point to find the best-fit equation.

Now that I have all the elements, I can circle back to the question that prompted the development of ELOR in the first place: How clutch had the All Blacks been in that game against South Africa? In the aforementioned game, they were down 30-13, away from home in South Africa, with 18 minutes to go. We can find the pregame probabilities from the above table.
New Zealand came in as an 88.2% favorite (about 430 points difference between their ELOR and South Africa’s ELOR), according to the ELOR. We can also estimate the initial margin (about 15.5 points) and calculate in-game probabilities. This is what happened:

With 19 minutes to go, South Africa was about a 75% favorite to win the game. Jumping to 5 minutes remaining, up 30-18, South Africa was an overwhelming favorite at 96.8%. This means that if this game was played 1,000 times and the score was 30-18 at the 75th minute, South Africa would win 968 of those games and New Zealand only 32. And this was one of those 32 games. With 5 minutes left, New Zealand’s odds were only of 31.25/1.
Coming back to the original question: Was that New Zealand team clutch in that game? And the answer is pretty straightforward. New Zealand was very clutch, coming back from 1000/32 odds to win the game. And in the end, the game ended as predicted by ELOR, with a New Zealand victory.
To test the ELOR, I used November’s 22 international matches. I once again used the Brier
Score to evaluate the skill of ELOR’s forecasting. I chose to compare the ELOR with the ranking system from rugbypass.com over the course of the November test matches. RugbyPass developed a Rugby Index (RI), which they use to rank individual players based on their action in games and is updated after each game. This allows them to compute the player’s shape in both club and international rugby. It is based on an adaptation of the ELO model and has been modified with human input and other algorithms. After computing the players’ score, a team score is established, which they then use to determine win probabilities.
Those are the probabilities I will test my model against. A couple of things on the Rugby Index: the Rugby Index for a team depends on the lineup, so it will take into account injuries, which my ELOR does not. If, say, a middling team misses their best player, the Rugby Index will probably be better equipped to adjust the Win % odds than my ELOR. The second element however is that since it tracks players in the top rugby leagues around the world on the club level to develop its rating, the Rugby Index only has 18 international team (with players who play in top club leagues) in its repertoire. My ELOR Rating, on the other hand, has tracked every team that has played at least one game since 1890. Where the ELOR rating lacks in predicting unusual events (a top player being injured for example), it has more depth than the Rugby Index at the international level (ratings for more teams past Canada).
The following table and the Brier Scores were computed for 22 games in November (winner in Bold):

Over 22 games, ELOR predicted 18 out of 22 games correctly (over 80%), while the Rugby Index predicted just one more correctly. The four games ELOR missed were:
1. Italy v Georgia, a Tier 1 / Tier 2 matchup. Georgia was a favorite, but Italy held on for a comfortable victory.
2. Scotland v South Africa. Favorite Scotland lost at home to underdog South Africa. The RI also predicted that one wrong.
3. Ireland v New Zealand. The first matchup between number 1 and number 2 in the world in a long time, New Zealand had a scare the week before against England and Ireland thoroughly dominated.
4. France v Fiji, another Tier 1 / Tier 2 matchup. Favorite France lost the game and its place in the top 8 of world rugby against the elite Tier 2 nation, Fiji. The RI also predicted that one wrong.
After all those games, ELOR was able to react and adjust, as Italy and Ireland closed the gap on Georgia and New Zealand and South Africa, and Fiji leaped Scotland and France respectively.
The ELOR model achieved a Brier Score of .113, and the Rugby Index achieved a Brier Score of .104.
The Rugby Index performed a little bit better, which is to be expected seeing as they have more “up-to-date” ratings that consider player forms and injuries. However, the ELOR rating still predicted almost 82% of the games correctly, up from 70% on the entire dataset and up from 71% for games where at least one Tier I team plays in the entire dataset.
The Brier Score also showed an improvement with .113, down from 0.19 on the entire dataset and down from 0.136 for games where at least one Tier I team plays in the entire dataset. Finally, although the Rugby Index might be slightly more accurate when it comes to the top teams, the ELOR rating I created provides information on many more teams and many more matches than the Rugby Index. The Rugby Index, for example, has no information on Namibia, one of 20 teams in next year’s World Cup. The ELOR rating has that information and could be used to calculate World Cup odds (see Appendix I).
1 http://www.footballperspective.com/the-biggest-quarter-by-quarter-comebacks-since-1978/
Conclusion
I was delighted by this first iteration of the ELOR. It is able to answer questions about in-game probabilities like “down 13 points with 15 minutes to go, what are New Zealand’s chances to win a game against Australia?”. ELOR holds its own in prediction capabilities and ability to quickly adjust its ratings and rankings based on recent results, providing a viable alternative to the World Rugby Ranking. It also allows establishing rankings for the earlier times of rugby, when the World Rugby Ranking did not exist. Furthermore, it is a tremendous tool when it comes to predicting tournaments, where it can be used in a Monte Carlo simulation (see Appendix I). It even performs better than forecasting models in other sports like basketball (see Appendix II). There are improvements to be made, however. I can look at developing an “autocorrelation adjustment multiplier” and margin coefficient myself, instead of using the ones FiveThirtyEight developed for the NFL. I could also look at weighing Tier I vs. Tier II matchups differently, which would probably help a team like Italy, who wins almost all their games against Tier II teams but loses almost all against Tier I teams, in the rankings. Another step would be to look for a complete dataset, or weigh World Cup games differently as they give us a rare opportunity to see Tier I and Tier II nations playing each other. For now, the first edition of the ELOR has performed better than I could have expected at the beginning of this project, and its accuracy will continue to improve as more games are added to the database. It will also be used to forecast next year’s Six Nations, hopefully improving on November’s 80% accuracy performance. ELOR is a viable, flexible and complete rating system for Rugby Union, one that has shown it is already up to par with other rugby union rankings systems and will only be ameliorated in future iterations.
Appendix
I. Forecasting the 2019 World Cup with a Monte Carlo simulation
I used a Monte Carlo simulation to simulate 10,000 World Cup results, and these are the results (Teams in the World Cup get a bonus point for scoring 4+ tries or losing by less than 7 points, but this simulation only accounted for wins and losses). I have used the ELOR ratings as of November 27, 2018.
Average wins for teams in a group will add up to 10 (with some rounding error) and the percentage chance of qualifying for the quarterfinal will add up to 200% since there are two spots for each group (top two teams). Thus:


With the Monte Carlo with 10,000 simulations, Ireland got 3.83 wins on average, Scotland 2.77, Japan 1.95, Russia .77 and Samoa .68.

With the Monte Carlo with 10,000 simulations, New Zealand got 3.9 wins on average, South Africa 3, Italy 1.43, Namibia .92 and Canada .75.

With the Monte Carlo with 10,000 simulations, England got 3.67 wins on average, France 1.93, Argentina 1.52, USA 1.68 and Tonga 1.2.

With the Monte Carlo with 10,000 simulations, Australia got 2.65 wins on average, Wales 3.61, Georgia 1.22, Fiji 2 and Uruguay .52.

As expected from their ELOR ratings, New Zealand and Ireland are the two overwhelming favorites for the World Cup. Only six teams, Wales, England, Scotland and Australia on top of the two mentioned before have over a 1% chance of winning the World Cup according to the model (with South Africa having a .99% chance). The likely semifinals are Ireland-Wales and New Zealand-England, a dramatic shift from four years ago when all four Southern teams (New Zealand, Australia, South Africa and Argentina) were the semi-finalists. Things can and will change, especially after the Six Nations of 2019 and some of the preparation games over the summer, but ten months away from the World Cup, the ELOR predicts a New Zealand win over Ireland, with the previously mentioned semi-finals in play. Finally, the most likely quarter-finals would be Ireland-South Africa, New Zealand-Scotland, England-Australia and Wales-France, leaving traditional heavyweight Argentina and underdog Fiji (who has the highest odds of advancing to the quarter-finals of any Tier II nation, close to 30%) watching from home.
II. Performance of the model vs. models in other sports
In evaluating the performance of my model, I looked for the performance of forecasting models in different sports. Once again using the Brier Score as a comparator, I found a blog post on “inpredictable2 ”, comparing their predictive model with ESPN’s NBA model, which came up with the following result:

At the beginning of the game, when the model forecasts win probabilities for teams, Inpredictable obtained a Brier Score of .215 and ESPN had a score of .197. The ELOR rating I have worked on and developed achieves a Brier Score of 0.19 at the beginning of the game, which is better than both the aforementioned models. This was a good indication of the performance of the ELOR model for world rugby, as evidenced by the lower Brier Score value obtained when predicting match winners compared to forecasting methods in other sports.
2 http://www.inpredictable.com/2018/01/judging-win-probability-models.html#more
Acknowledgments
I wanted to acknowledge Eta Cohort classmate Ted Carlson’s help in directing me towards the Brier Score as a valuable estimate of my forecasting model’s accuracy. I also wanted to thank my parents who share my love of rugby and advised and supported me in the building and testing of this model.