| By Ethel Shiqi Zhang |
As students in the Master of Science in Analytics (MSiA) Program, we are given a plethora of opportunities to engage with clients to apply our newly-minted analytics skills by tackling real-world problems.
This year, a group of four students paired up with IBM Analytics to carry out a project with Chicago Botanic Garden (the Garden). As the spring quarter ended, we also wrapped up this five-month long project with the Garden. The project really had it all — there was laughter, confusion, challenges, and midnight munchies. Here is a recap of this wonderful project with the Garden from my perspective. I hope it will help you gain some insights into the student life at MSiA and how we practice Data Science in real life to make impacts.

To guide your journey through this memoir, I’ve broken it down into four parts.
- Client Overview
- Project Mission
- Data Analytics in Practice
- Lessons Learned & Next Steps
Now that you are equipped with the map to this journey, let’s get started!
I. Client Overview
The Chicago Botanic Garden (the Garden) came into existence more than 40 years ago (1965), and it aims to be Urbs in Horto, meaning “city in a garden”. In 2017, more than one million people visited the Garden’s 27 gardens and four natural areas.
The Garden has around 50,000 members as of 2017, making its membership base one of the largest of any U.S. botanic garden. Members of various ages, interests, and background participate in programs, take classes, and stroll the grounds year-round. At times, these members make donations to assist the Garden with achieving its mission.
II. Project Mission
With such a large membership base, the Garden is interested in leveraging a systematic analytical approach to derive some effective ways to engage its members and reinforce their connections with the garden.
With this goal in mind, the project team divided the project into two phases. Phase I focuses on exploratory data analysis which allows the Garden to understand the overall portfolio of its members. Phase II focuses on discovering the natural groupings of the members in order to target efforts towards donors who donate in different patterns.

III. Data Analytics in Practice
Phase I: Exploratory Data Analysis
The exploratory data analysis phase is when a lot of the data cleaning and Tableau charting happened. As we got more familiar with the data, we found some interesting insights which guided us in our feature selection for the next phase.
One of the thought-provoking insights in the first phase was the manifestation of the 80/20 rule. We discovered that less than 10% of the members donated over 80% of total donation to the Garden.

As a result, when studying donation behavior, we were really looking at a small sample size and searching among the 50k members for the ones who were most likely to donate.
Phase II: Clustering
To systematically identify the members who felt strong connections with the Garden (manifested in donations in this case), we carried out a clustering exercise. The methodology of our clustering can be broken down into this 6-step process and summarized in this beautiful graph made by one of my teammates:
- Feature Selection
- Data Preprocessing
- Dimension Reduction (Principal Component Analysis)
- Multiple methods clustering
- Clustering results evaluation
- Clusters formation & interpretation

Following these steps, we identified 6 clusters for the 50k members of the Garden. The distribution of the clusters mirrors the distribution of the donation amount that we have seen earlier: only a small percentage of the members are identified as high potential donors.

Once we finalized the clusters, we performed more exploratory data analysis to profile the clusters:
To understand what makes each cluster different, we studied the underlying differences between clusters. Several attributes out of the 70+ attributes we selected explained the differences the most. Some of these attributes include distance to park and historical park events attendance.
To understand why people in the same cluster still have diverging donation behaviors, we studied the difference within clusters between donors and non-donors. Several attributes seems to contribute most to the within clusters differences. One of such attributes is event attendance. In most cases, the donors participate more in park events than the non-donors.

Data Driven Recommendations
Discoveries like this gave us the foundation to design a targeted relationship management strategy for the Garden. For example, in the case of event engagement, a reasonable strategy is to engage the Park Lovers who have not been donating (Park Lovers non-donors) to attend more featured and seasonal events in the hope of bringing their engagement with the park to the level of their fellow Park Loving donors.
With analysis like this, we were able to advise the Garden to customize its engagement strategy in a more effective fashion.
P.S. If you are wondering what a featured / seasonal event is like, here is a picture from the Orchid Show at the Garden, a seasonal event hosted in March 2018.

IV. Lesson Learned & Next Steps
It has been a great journey working with the Garden and IBM. I was excited to apply the data science skills I learned in school to real life problems and hopefully make an impact.
I have learned so much working with this brilliant team. In terms of my biggest take-away, instead of repeating the cliché that data is messy and arguing for what the best clustering model is (the answer by the way is almost always “it depends”), I want to focus on one message that I took home from this project: your model only matters when it can make an impact.
No matter how good your model is on paper (e.g. low BIC score or high silhouette score), it doesn’t matter until it can make an impact. That can mean that your clustering result should be interpretable or that it is actionable. Even the definition of impact will differ from case to case. The point is, as much as you should let your data guide you to discoveries, you should also not lose sight of why you came to the data in the first place.
So, I’m interested to see how our recommendations for the Garden will work out in the near future.
Before then, I hope that the memoir of my journey on the Garden’s project make an impact on demystifying the application of data science in real-world business problems.
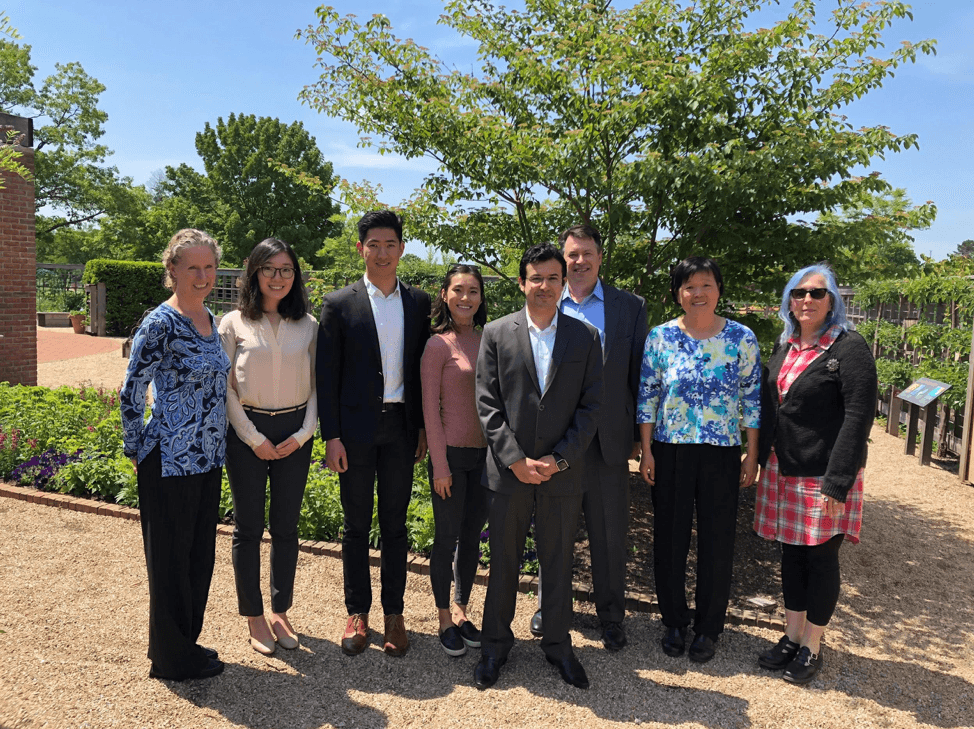
Acknowledgements: This project has been carried out by four MSiA students and is supported by both the Garden and IBM. The project team in figure 7: (left to right) Gwen Vanderburg (Garden), Jamie Chen (MSiA), Michael Gao (MSiA), Ethel Zhang (MSiA), Ahsan Rehman (IBM, MSiA alumnus), Andrew Warzecha (IBM), Jane Chu (IBM), and Carolynn Kotlarski (Garden).