
The Global SARS-CoV-2 Surveillance Project: Policy, Persistence & Transmission
The Global SARS-CoV-2 Surveillance Program (GASSP) has been retired effective March 15, 2023 due to the lack of reporting. However, the website will be maintained to preserve historical tracking and statistical modeling of COVID-19 transmissions and deaths.
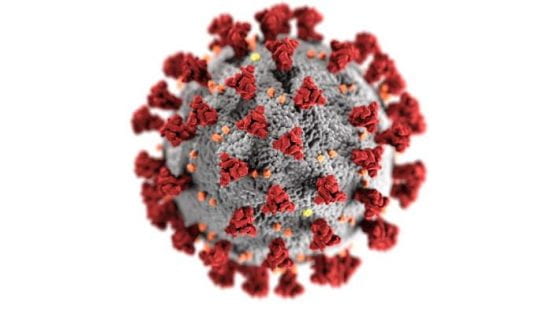
Without question, SARS-CoV-2, the novel coronavirus that causes COVID-19 has resulted in an unprecedented pandemic in modern history with significant morbidity and mortality that has a deleterious impact on the global economy, violence, mental health, and food security. Public health surveillance informs the policy needed to eliminate COVID-19 which depends on a variety of metrics to identify high-priority events.
Surveillance Metrics
The SARS-CoV-2 Global Surveillance Project provides standard surveillance metrics that are useful and allow us to compare regions even though they are limited to more severe cases and suffer from incomplete case ascertainment and data contamination. To address these data limitations, we validated additional novel surveillance metrics of (1) speed, (2) acceleration, and (3) jerk (change in acceleration), (4) 7-Day Lag, (5) 7-Day Persistence effect.
KEY TERMS
Global SARS-CoV-2 Surveillance Dashboard
The basic question we are trying to inform is: how are we doing this week relative to previous weeks? From a public health perspective, in the midst of a pandemic, we would like (at least) three affirmative responses: (1) there are fewer new cases per day this week than last week, (2) the number of new cases is declining from day to day, and (3) the day-to-day decline in the number of cases is even bigger this week than last week. Additionally, we would like some indicative information about significant shifts in how the pandemic is progressing —positive shifts could be the first indicators of the emergence of a new or recurrent hotspot, and negative shifts could be the first indicators of successful public health policy.
GASSP Featured Website

The International Food Policy Research Institute (IFPRI)
IFPRI provides research-based policy solutions to sustainably reduce poverty and end hunger and malnutrition in developing countries. IFPRI’s vision is a world free of hunger and malnutrition. Its mission is to provide research-based policy solutions that sustainably reduce poverty and end hunger and malnutrition. Their regional and country programs play a critical role in responding to demand for food policy research and in delivering holistic support for country-led development.