The current election season has been unprecedented, to say the least. The tone of debate, and some of the ideas being expressed by one candidate in particular—especially doubts about the value of democracy itself—make this year seem like a radical departure from what has come before.
In other ways, though, the actual results of this election are very likely to reflect more continuity than change. This is particularly true in the dynamics of so-called Red and Blue America. Partisanship, ideology, and policy preferences are strongly related to place character—that is, whether a person lives in central city, suburb, or rural area. In particular, big-city residents are much more likely to support Democratic candidates, and to identify as liberal, than suburbanites or rural Americans, even when we account for many other important factors.
This connection between national policies, urban communities, and urbanites has strengthened over time, and today urbanites tend to support Democratic candidates in almost all American cities. More than state or region, the city-country divide defines America’s political geography. We’ll write a bit more about this in future posts.
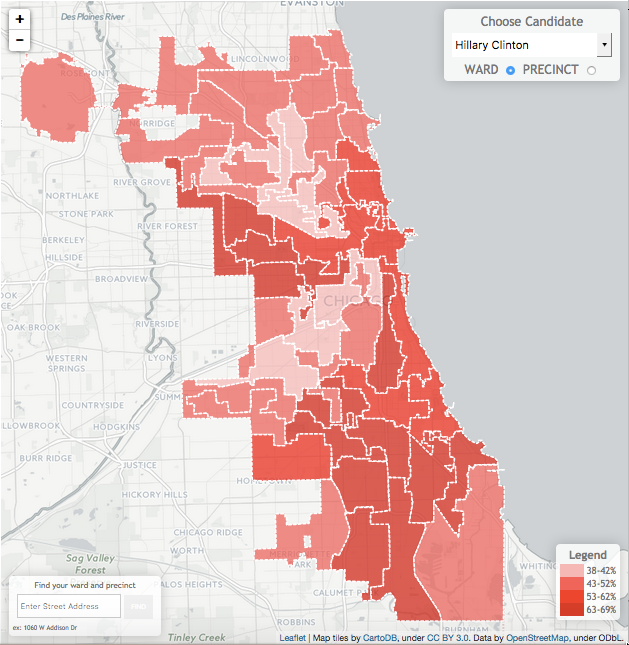
But what does this mean for Chicago in 2016? Well, in short, it means that by all indications we are likely to once again see overwhelming support for Hillary Clinton from all parts of Chicago. Using the Chicago Democracy Project’s new Chicago Elections Database, we can use recent election results to get a glimpse. I’ll turn to results from the elections most like the upcoming one—the 2016 Primary and the 2012 General elections.
Past as Prologue?
The 2016 primary season was a hotly contested in both parties. Bernard Sanders and Hillary Clinton each won a major share of the votes cast in the nation and in Chicago. Clinton won overall in the city, with particularly strong showings on the South Side, West Side, and downtown wards:
On the Republican side, Donald J. Trump was the plurality winner in a much more crowded field, both nationally and within Chicago. All the GOP candidates did best on the affluent near North Side and in the “bungalow-belt” areas near the edges of the city. Among GOP candidates, Trump did best in the latter areas:

That said, the primary races in Chicago were of different orders of magnitude. While some areas of Chicago have a reputation for being more conservative, and Chicago certainly has its share of significant political divisions, these don’t really play out at the ballot box in national elections. For instance, in none of Chicago’s 50 wards did any Republican candidate receive as many votes as EITHER Clinton or Sanders. Here’s a Figure showing what percent of the OVERALL vote (ie, all ballots cast in both the Republican and Democratic primaries) each candidate received. Each row is for a candidate, and each dot represents the percent of overall votes that candidate got in a ward (ie, each row has 50 dots):
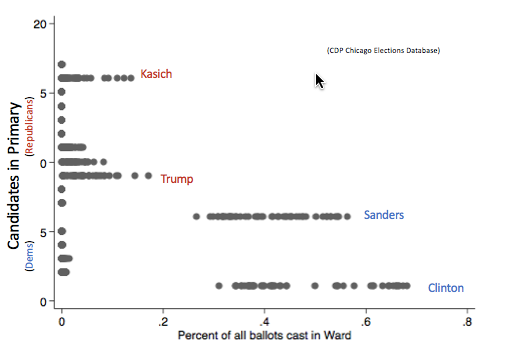
So even where Trump did the best against his GOP rivals, he still received far fewer votes than EITHER Clinton or Sanders. This makes sense in a city in which the last mayoral election was almost a trial run of this year’s Democratic Primary (we’ll have another post on this soon), and in which both sides agreed on the things that divide national Republicans and Democrats.
Does this mean that we should expect 90 percent of Chicagoans to vote for Clinton? About that, yes. In 2012, a closely contested presidential election between Obama and Romney was NOT very closely contested here. Here’s the CDP map of the 2012 election:

Obama won a majority in every Ward, and well over 90% in many parts of the city. Part of that had to do with his historically strong support in largely African American communities (which is amplified in this map by Chicago’s stark segregation), but he ran well ahead of his national averages in all but one ward. Given the campaign dynamics so far, and Trump’s underinvestment in mobilization efforts, this gap may be even larger in favor of Clinton when the votes are counted on November 8.
In Illinois, statewide elections—because of the electoral college, the Presidential election is really 50 statewide elections, aggregated—have long been by the difference between two numbers—how much the Democrat wins by in Chicago, vs. how much the Republican wins by outside Chicago. Most of “outside Chicago” is actually the Chicago suburbs, which are themselves sliding into the Democratic column as they become more diverse and less antagonistic to the city at the heart of the metro region. That’s what makes Illinois a “safe” state in presidential projections, but also what makes it more closely contested in off-year cycles. Chicago turnout determines the critical outcomes in our local, state, and national elections. Clinton will win Chicago by a lot, and Illinois comfortably. The real contests will come down-ballot, where several House Republicans may be vulnerable, and the incumbent Senator Mark Kirk seems likely to lose his seat to Democratic Congresswoman Tammy Duckworth.
What’s Next?
Get out and vote! Early voting is ongoing in Chicago. For information on how to do that, visit the Chicago Board of Elections, which has a great website for registration and precinct location information. Northwestern’s Center for Civic Engagement has also developed NUVotes.org, a great new tool for election information (though for most out-of-staters the windows have passed). For more information about where the candidates stand on the issues, visit their websites or non-partisan electoral resources such as ballotpedia.org or ballotready.org.
Check back in with the CDP after the election for some analysis of the election and other issues important for local politics. And please explore the database yourself! It’s a great tool for quickly seeing how electoral politics has played out for the past decade in the Windy City.
You must be logged in to post a comment.