Analysis of seismograms from the December 26, 2004 Sumatra earthquake that generated the devastating tsunami shows that it was much bigger than previously thought and explains in part why the tsunami was so destructive.
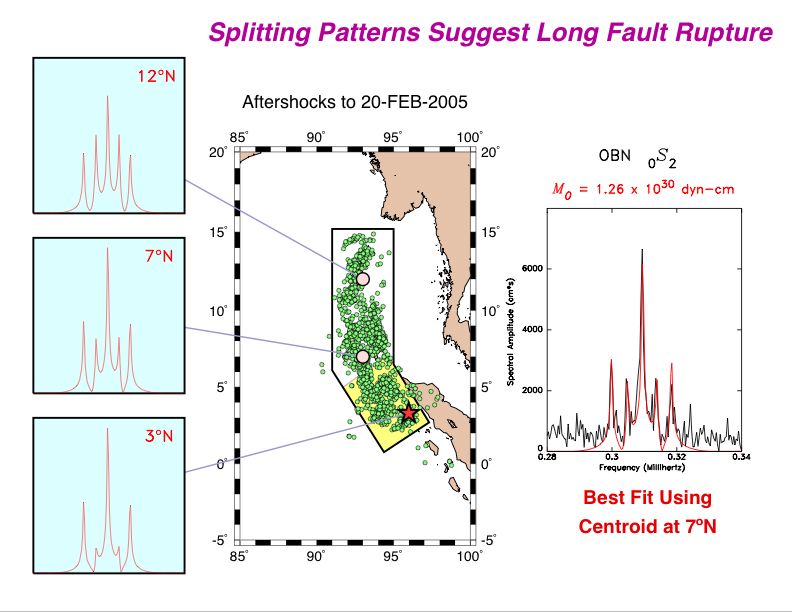
Measurements of seismic energy at vibration periods much longer than previously studied show that the earthquake was approximately three times larger than previously reported. Its revised moment magnitude, Mw= 9.3 instead of the previously reported 9.0, makes it the second largest ever recorded since the invention of the seismometer about 100 years ago. The rupture occurred by slip along the 1200-km long fault delineated by aftershocks, making the rupture zone much larger than previously thought from analysis of shorter period waves. The amplitudes of the earth’s split normal modes show the larger fault area, because they are better fit by a source at 7N, in the center of the rupture zone, than by one at the epicenter at 3N.
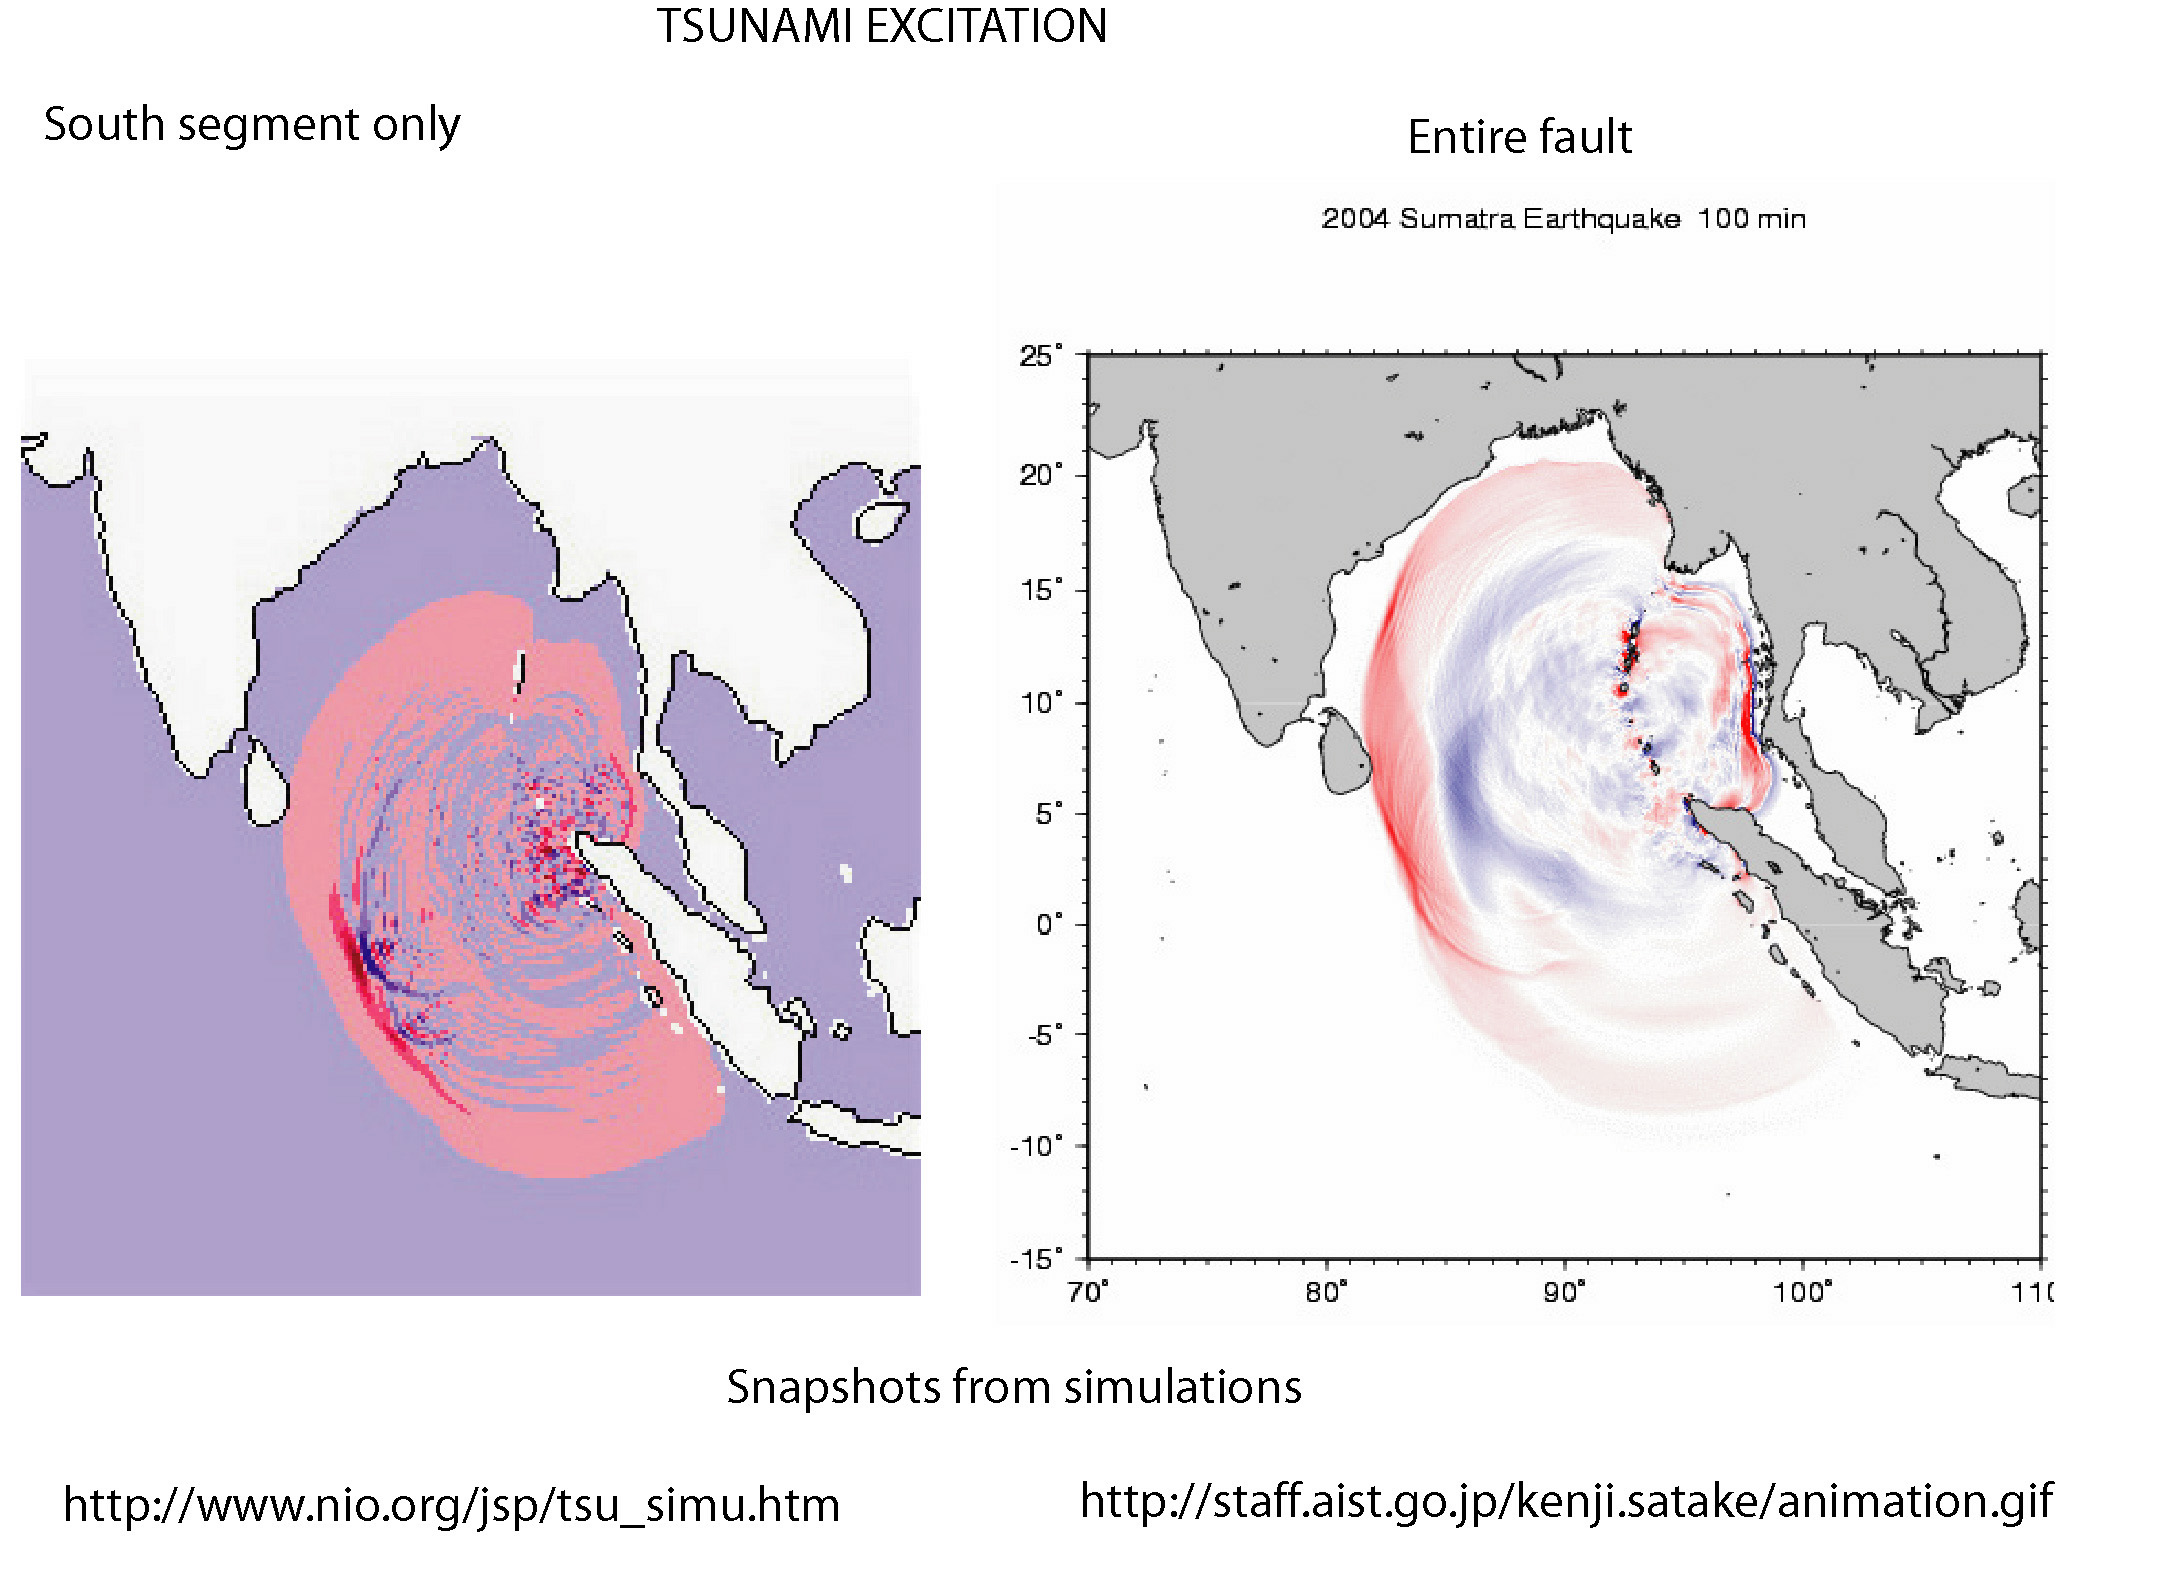
This long rupture played a key role in generating the devastating tsunami. In particular, the large tsunami amplitudes in Sri Lanka and India result from rupture on the northern, north-trending, segment because tsunami amplitudes are largest perpendicular to the fault. This effect is shown by comparison of snapshots from two tsunami animations.
Because the entire rupture zone slipped, strain accumulated from subduction of the Indian plate beneath the Burma microplate has been released, leaving no immediate danger of a comparable tsunami being generated by water moved by an earthquake on this segment of the plate boundary. However, the danger of a local tsunami generated by a large aftershock or a comparable ocean-wide tsunami resulting from a great earthquake on segments to the south remains.
These results come from analyzing the earth’s normal modes – ultra long vibrations by which the earth rings like a bell (or more precisely rattles like a garbage can) for days and even weeks after such a gigantic earthquake. Analysis of long seismograms shows distinct energy peaks whose height reflects the earthquake’s seismic moment, which gives its magnitude. Because the magnitude scale is logarithmic, the threefold increase in seismic moment raises the magnitude by 0.3 units, making it second only to the 1960 Chile earthquake.
Curiously, the analysis technique relied on results we developed with Robert Geller (now at the University of Tokyo) as graduate students almost 30 years ago. However, because such gigantic earthquakes are rare, these methods had been essentially unused until records of the Sumatra earthquake on modern seismometers became available. These data were provided by the Global Seismographic Network of the Incorporated Research Institutions for Seismology.
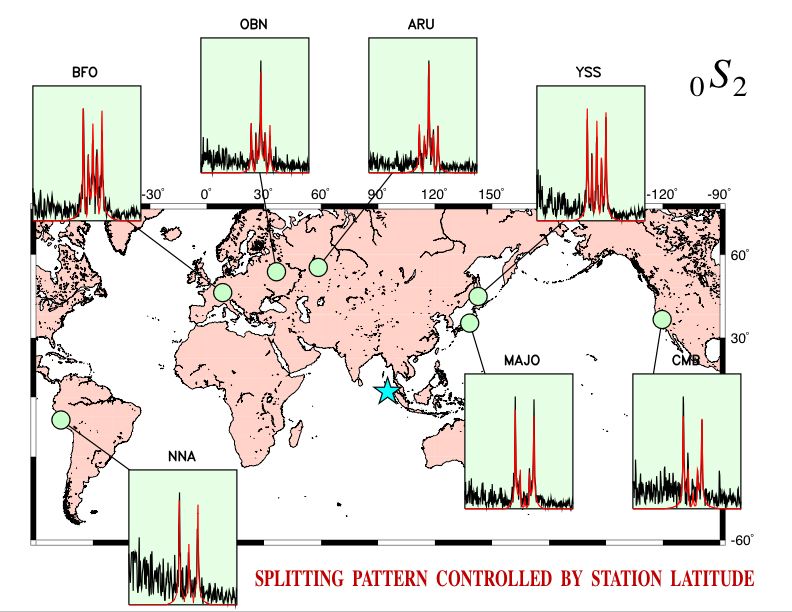
Examples of seismic data from around the world that we analyzed.
The size of the earthquake is given by its moment magnitude Mw, defined as Mw = (log Mo / 1.5) – 10.73 from the seismic moment Mo in dyn-cm. Thus the Harvard CMT solution at periiods 300s and below measured a moment of 4e29 dyn-cm giving Mw 9.0, and the longest period normal mode 0S2 gives Mo 1.0e30 dyne-cm or Mw 9.3. The moment and magnitude rise smoothly with period, as shown in the technical report linked below. This makes the earthquake gigantic, as illustrated by comparison with some other earthquakes below.
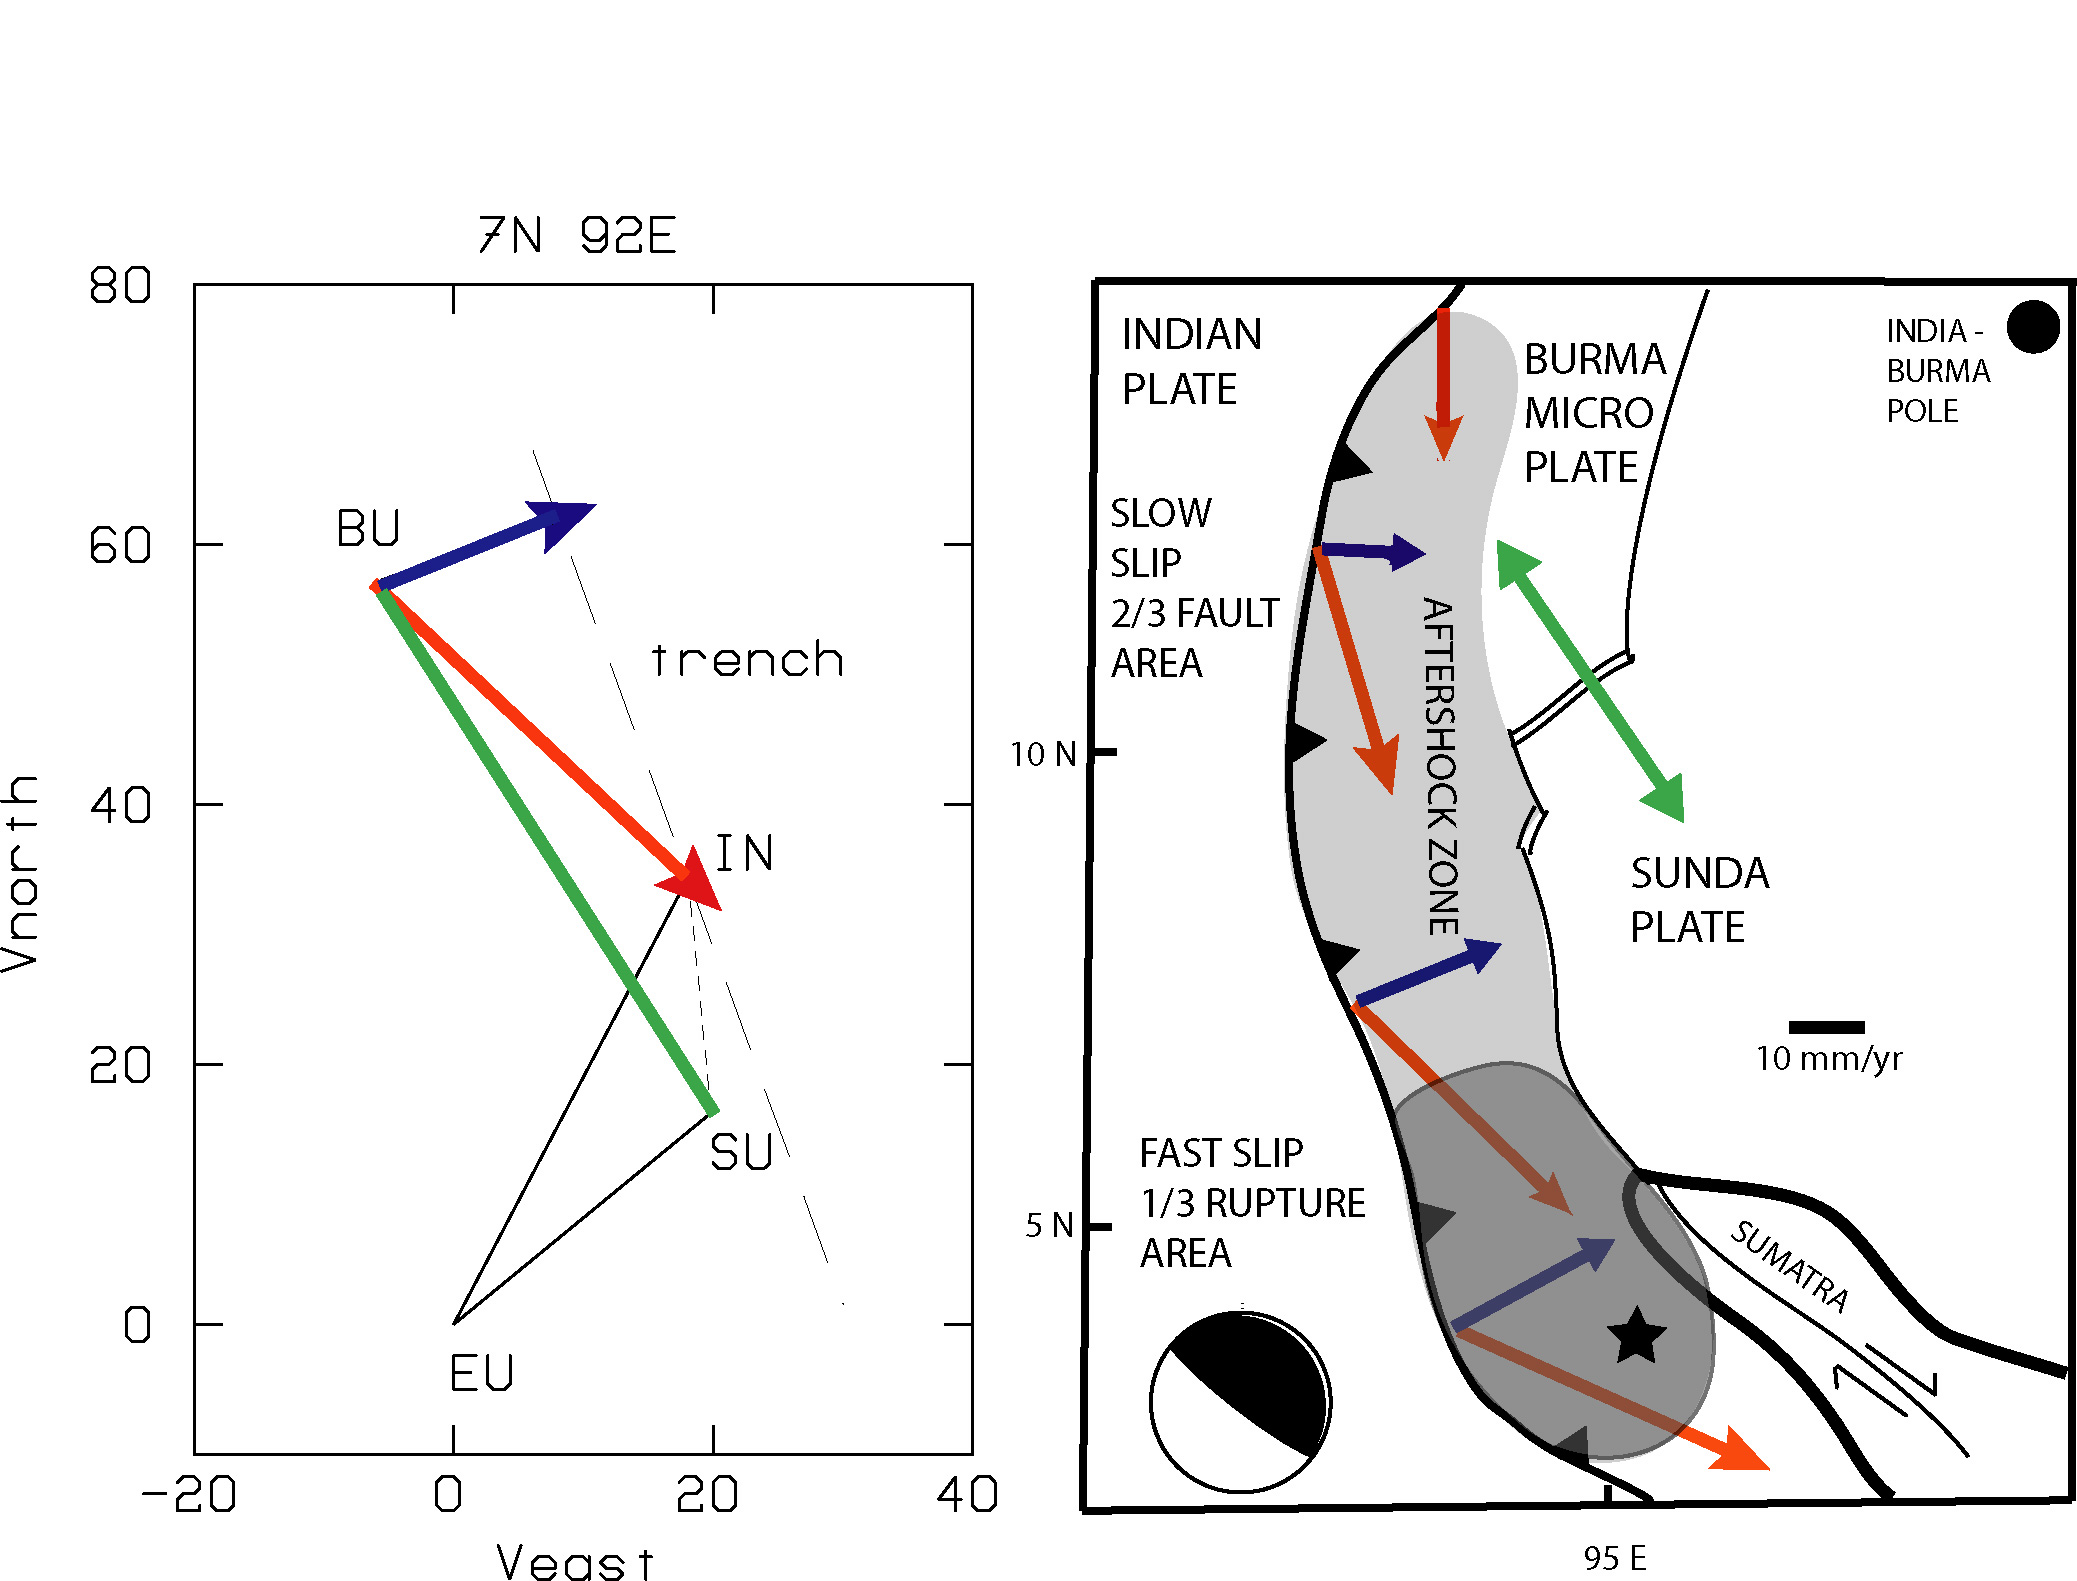

The relative plate motions between the Indian, Sumatra, and Burma plates give insight into the tectonic setting of the earthquake, how often it may recur, and the extent of the rupture. GPS studies show that both India and Sunda move northeastward relative to Eurasia, and the rate of spreading between the Burma sliver and Sunda (green arrow) has been measured using marine magnetic data. Combining these results yields an Euler vector whose rotation pole (dot) shows that the net convergence between India and Burma is oriented NW-SE (red arrows). The component perpendicular to the trench (blue arrows) presumably is released in great earthquakes like this. Because this component is about 15-25 mm/yr, depending on the pole position, rate, and location along the trench, we would expect earthquakes like this to occur at least 400 years apart on average.
 As an outgrowth of these studies, we have been working with Geoffrey Blewitt, Corne Kreemer, Bill Hammond, and Hans-Peter Plug of of the University of Nevada, Reno, geodetic laboratory to improve tsunami warning systems. Although seismological systems can detect large earthquakes, assessing the earthquake’s true size and tsunami potential is challenging. The challenge is illustrated by the fact that seismic magnitude estimates for the first hour after the Sumatra earthquake were far too low incorrectly indicating no danger of a major oceanwide tsunami. However, using the positions of ground sites derived from the GPS satellites, we have shown that the earthquake’s true size and tsunami potential could be accurately determined using only GPS data recorded up to 15 minutes after the earthquake origin time.
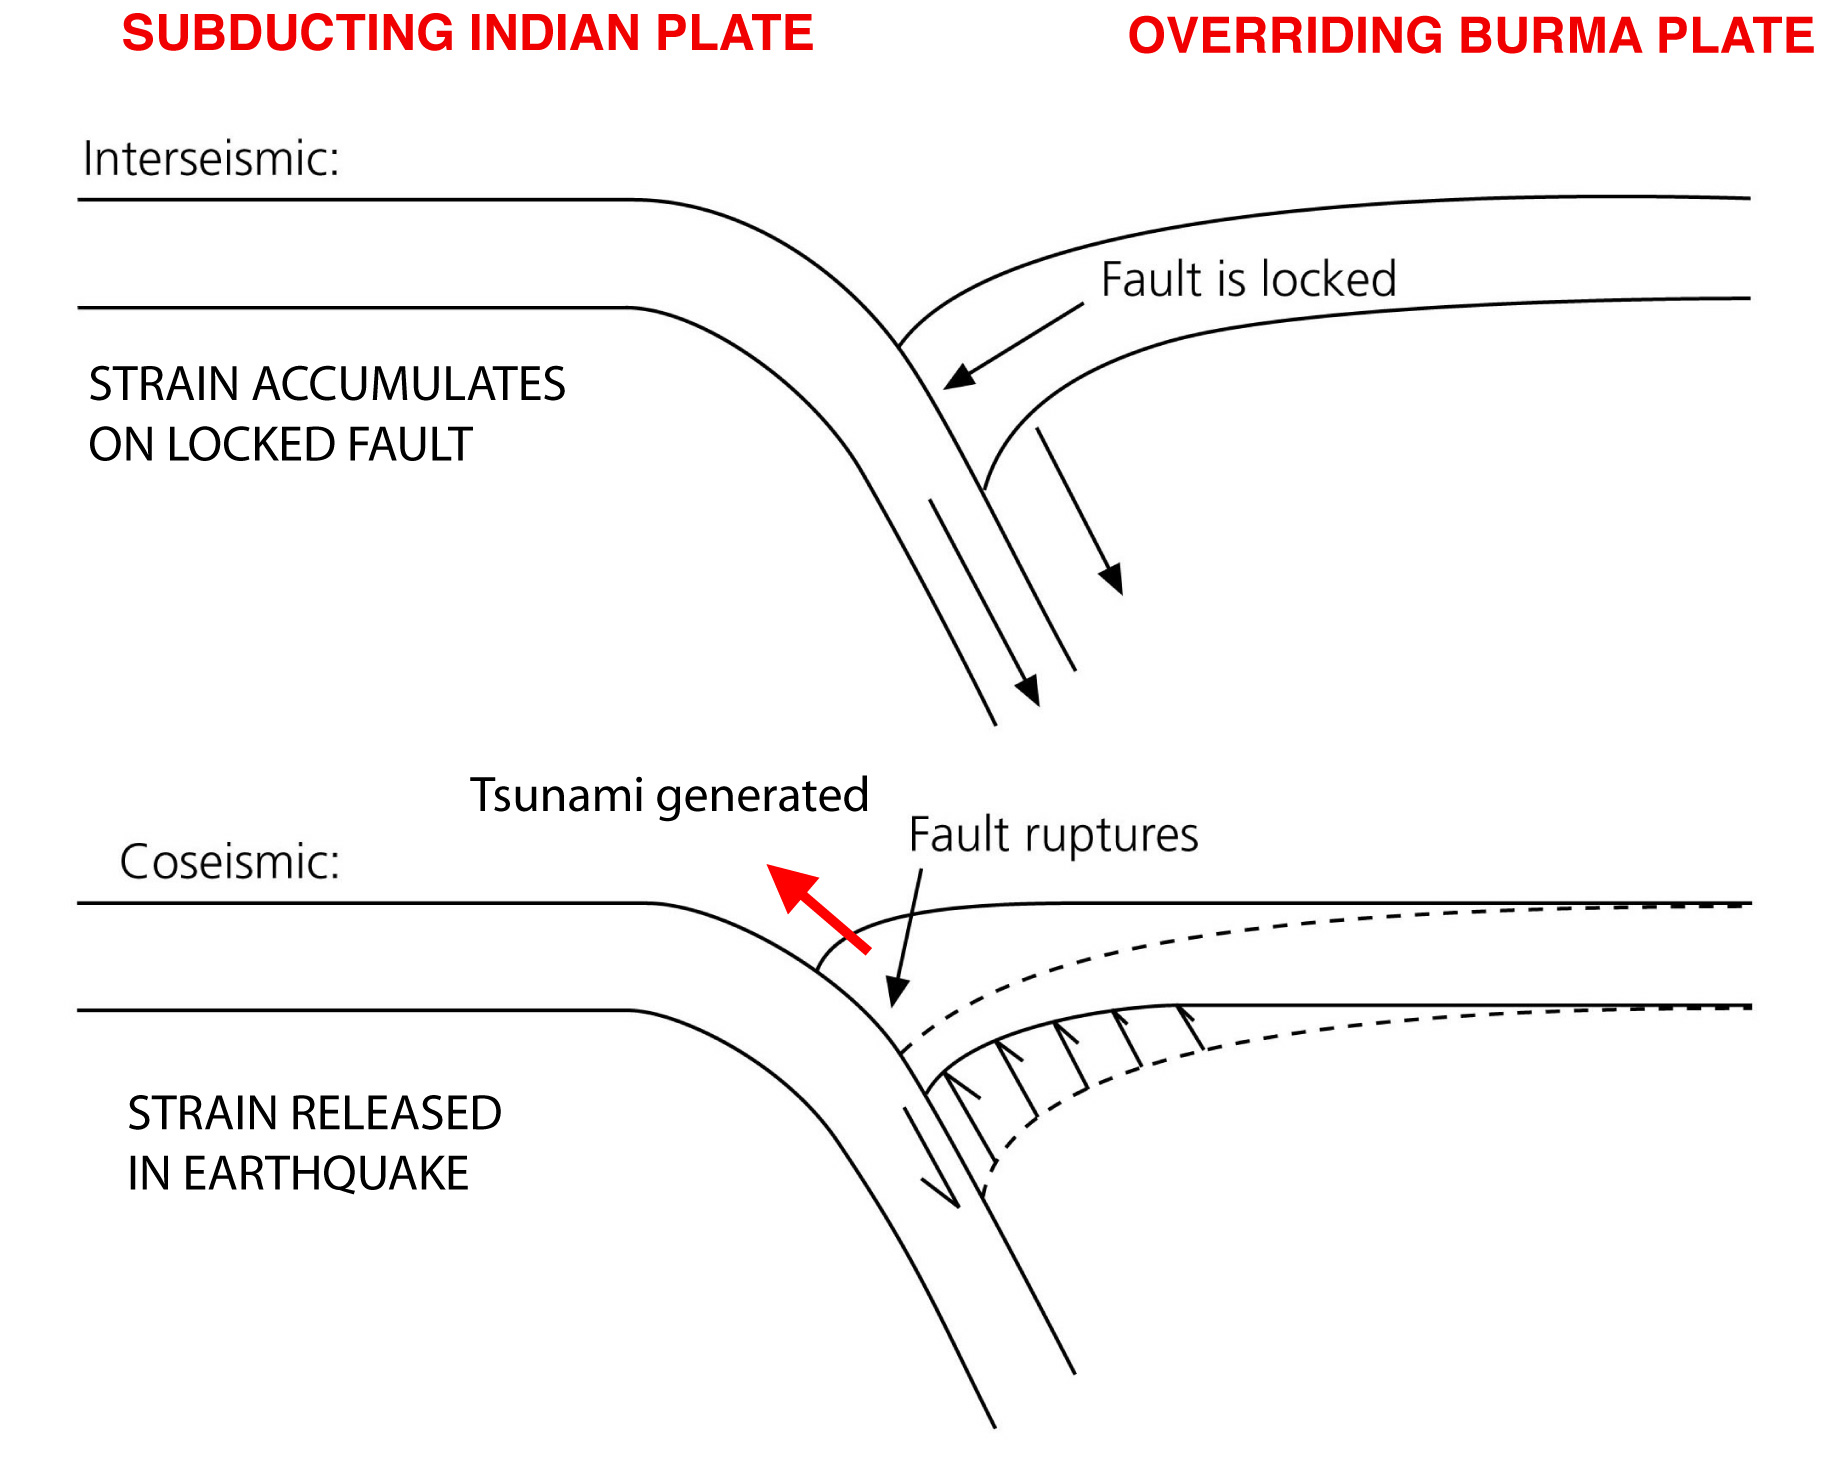
GPS detection of ground deformation associated with great thrust fault earthquakes at a subduction zone. Between earthquakes, strain associated with the subduction accumulates of the locked plate interface. The earthquake releases this strain, causing ground motion that generates the seismic waves in the earth and the tsunami in the ocean. The resulting motion of GPS sites can be combined with results from seismic waves to determine the size of the earthquake and the geometry of faulting.
Seth Stein and Emile A. Okal
Department of Geological Sciences
1850 Campus Drive
Northwestern University, Evanston Illinois 60208 USA
seth@earth.northwestern.edu
emile@earth.northwestern.edu