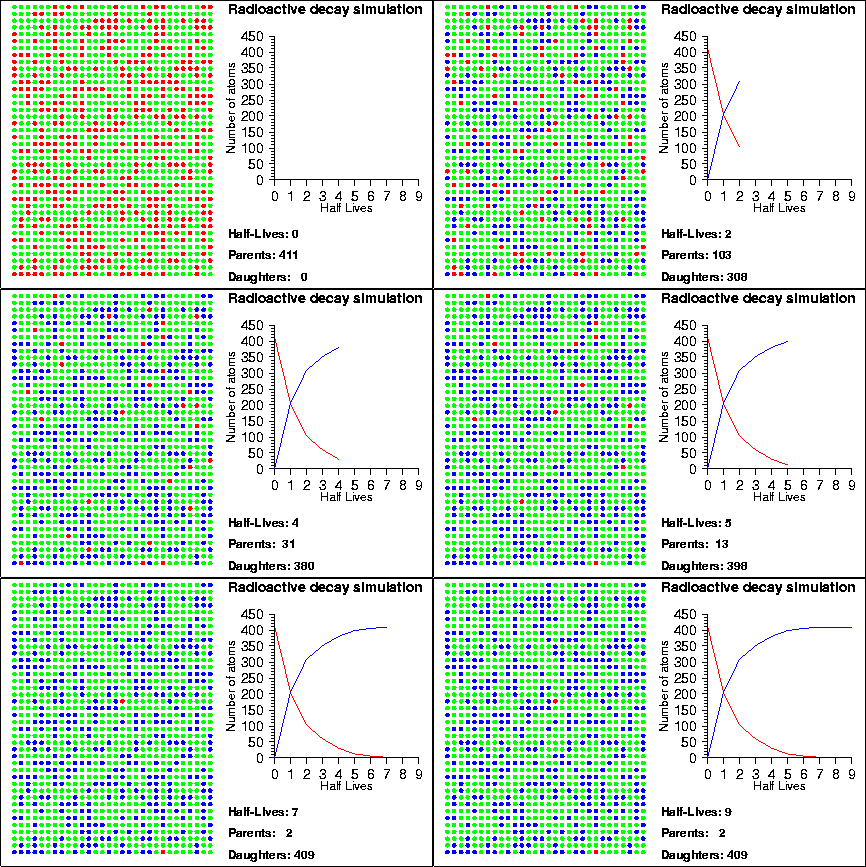
Demonstration goals:
- Understand how radioactive materials decay
- Be able to use parent/daughter ratios to find the age of a material
IDEA:
When a radioactive isotope decays, it creates a decay product. By comparing the number of parent and daughter atoms in a sample, we can estimate the amount of time since the sample was created. In the animation, the radioactive isotopes are represented by red circles, the decay products are the blue circles and the neutral isotopes are the green circles.
One of the most important tools in geology is radioactive decay. By measuring the ratio of parent to daughter atoms in a mineral sample, we can find the time at which a mineral formed. The amount of time it takes for half of an parent isotope to turn into its daughter isotope is called the half-life. If you know the half-life of an isotope, and the amount of parent and daughter atoms present in a sample, you can calculate the age, t, of the sample using:

 is the decay constant, D is the number of daughter atoms and N is the remaining number of radioactive atoms. This age is an actual measurement of elapsed time, instead of arelative measure (e.g., old, older, oldest); we therefore call time scales based on radioactive decay absolute time scales.
However, it is important to remember that an absolute time scale relates to a measurable physical process, not that there are no errors in the measurement. There are many processes which can make a mineral appear to have a different age than it actually does. If daughter atoms can leave, or parent atoms can be added, then the mineral will appear to have a higher parent-daughter ratio, and so will appear younger than it really is. If parent atoms can leave or daughter atoms can be added, then the mineral will have a lower parent-daughter ratio than it should, and so will appear older than it really is. This can happen when the mineral reacts with other things, such as sea-water or ground water. A geochronologist would say that “the box wasn’t closed”.
How do we know when a given atom will decay? The half-life of an element measures the mean time it takes for half of the parent atoms to decay into daughters but it says nothing about the behaviour of any given atom. Instead, the life-time of any given atom is essentially random; one atom may only last one half-life, whereas another may last several hundred half-lives. The mathematical laws that describe radioactive decay also describe a variety of other natural processes, such as rolling dice, flipping coins or the number of raindrops that hit in a square centimenter. Because of this, sometimes these other processes are used to model the decay process; in the animation shown above, we used a random number generator to determine when each particle would decay.
To do this experiment, you will need:
- Box, with one side marked (shoe boxes work well)
- Toothpicks (plain and colored)
- Graph paper
1. Measure and record the dimensions of the box. Mark one side of the box (e.g., with tape or magic marker). Put the 32 plain toothpicks (parents) into the box and close the lid.
2. Shake the box vigorously, and then open it. Count and remove all of the plain toothpicks which are pointing at the marked side; these have “decayed”. Replace them with colored toothpicks (daughters).
3. Record the number of plain and colored toothpicks remaining in the box in the chart. Repeat the process until no more plain toothpicks are left.
4. Now plot the number of remaining plain toothpicks and the number of colored toothpicks on the graph. Point out that this resembles a decay curve.
For Discussion:
What is the half-life for the toothpicks in this experiment?
If you found a box with only four plain toothpicks in it and 28 colored, how `old’ would you estimate the box to be?
What effects might change your age estimate? (HINT: How would adding plain toothpicks affect your estimate? Adding colored toothpicks? How about random chance?)
You may want to use the chart below to relate radioactive isotopes and their half-lives to various events in history. Have the students estimate how far back they can be used to date events, and match the events with the isotope.
Isotope: |
Half-Life: (Years) |
Time: (YBP) |
Event: |
| C-14 K-40 Rb-87 Sm-147 |
5,570 1,400,000,000 47,000,000,000 106,000,000,000 |
500 2,487 2,790 4,347 20,000 1,500,000 36,600,000 66,000,000 66,400,000 570,000,000 4,500,000,000 15,000,000,000 |
Settlement of America by Europeans Battle of Marathon Founding of Rome Sumerian Civilization Settlement of America by Indians First hominid appears Start of the Oligocene Formation of the Alps Dinosaurs die out First animals appear Formation of the Earth Formation of the Universe |
Related pages:
