| By Logan Wilson |
Introduction
One of the primary contributions of Twitter to modern media is the notion of the “hashtag” – a single word or phrase that captures an idea, concept, or movement. As more and more people see and share the hashtag, the movement grows and evolves, giving way to new ideas and forming new hashtags. By applying modern analytical techniques of network analysis and natural language processing, paired with the huge troves of available Twitter data, we can examine these hashtags and their relationships to better capture the underlying ideas.
On October 6th, 2018, Brett Kavanaugh was sworn into the Supreme Court after several weeks of fierce debates and accusations regarding Kavanaugh’s alleged sexual misconduct. Throughout the entire period, Twitter served as a platform for humans (and bots) all around the world to voice their opinions and advocate for ideas via their usage of hashtags. Three days later (which is conveniently when I was able to get my Twitter API access sorted out), Twitter was still awash with memes and emotions surrounding the event. The idea was simple – design a network of related hashtags, identify the internal communities, and semantically analyze the tweets associated with each community.
Data Collection
The first problem involved first obtaining the data. The search functionality of the Twitter API is fairly robust, but determining what to search for proved an interesting puzzle. Many ideas and perspectives on Twitter can be related to a subject without referring to it explicitly. For example, consider the tweet in Figure 1 that was retweeted over 126,000 times.

It’s clearly referring to a social perspective connected to the allegations against Kavanaugh. Yet, if we only searched for tweets explicitly referencing Kavanaugh, we would miss tweets like this altogether.
My solution requires a little bit of creativity, and a lot of patience. I started by scraping 1,000 tweets containing the hashtag “#kavanaugh.” I then extracted all of the hashtags from these tweets (roughly 500). Then for each of those hashtags, I scraped another 1000 tweets. So in the first 1,000 tweets directly referencing #kavanaugh we’d likely find at least one tweet referencing #TheResistance, which would then allow us to scrape Lynzy’s tweet above. The Twitter API limits you to a max of 18,000 tweets every 15 minutes, so this can take quite a while. Additionally, a lot of the results returned are retweets, so after we remove all the duplicates we end up with around 130,000 tweets. While this is certainly not reflective of the entire universe of related tweets, it’s a good place to get started.
Building the Network
After a little bit of processing (okay, a lot – Twitter data is ugly), we can start building our hashtag network. We’ve got way too many hashtags (around 95,000), so we first eliminate all hashtags occurring less than 100 times, since hashtags used by only a few people won’t be able to tell us much. We create links in our network using the Jaccard index formula in Figure 2.

Specifically, we define an undirected edge to exist between two nodes if their Jaccard index is greater than 0.1. This means that hashtags #A and #B are connected if at least 10% of tweets containing either #A or #B contain both #A and #B. We can build and visualize the network with the Python library NetworkX, as shown in Figure 3.

While the Pollock-esqe splatter may inspire some artistic stirrings, it isn’t terribly informative. Looking closely, we see 2 fairly large components and a lot of small, isolated components. Note that if we set our threshold for the Jaccard index to much lower, the network would be much more connected. It would also be much more difficult to distinguish the communities, not to mention the computational expense of plotting thousands of connections.
If we prune these isolated components, our network starts to look a little more coherent, as we see in Figure 4.

Examining the hashtags associated with the nodes in the larger component on the top of the graph, we find several fairly irrelevant topics, like #FoxNews, #EU, and #FederalReserve. While each of these reached the occurrence threshold of 100 tweets and can certainly be politically charged, they likely won’t tell us much about attitudes surrounding Kavanaugh’s confirmation, so we can remove this component as well. In the lower component, which includes hashtags like #InnocentUntilProvenGuilty and #MerrickGarland, the relevant topics are starting to become clearer.
Community Detection
We can use a partitioning algorithm to automatically identify communities based on the structure. I used a fast and intuitive algorithm known as the Louvain Method. This algorithm effectively aims to maximize modularity, a measure of how connected nodes within each community are to each other relative to nodes from other communities. Initially, each node is assigned to its own community. These communities are then combined one at a time in an agglomerative manner until modularity is maximized.
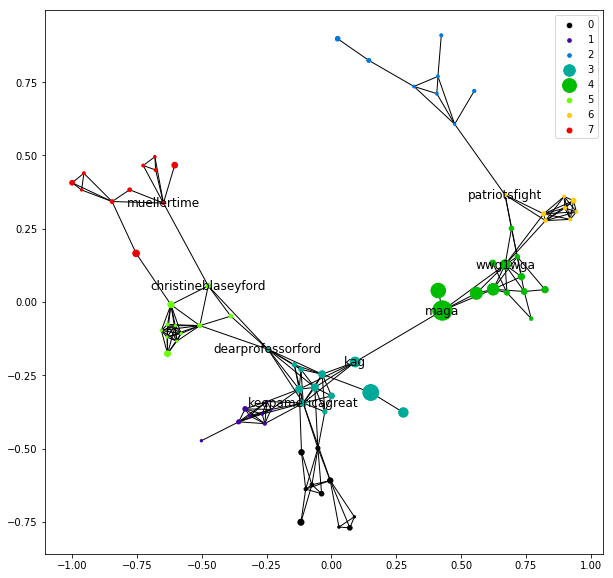
We can visualize the network again with community indicated by color, as we see in Figure 5.

Network Evaluation
The partitioning of these communities certainly make sense – but what’s in them? To get a better sense, we can apply some basic network analysis. Within each community, we compute the closeness centrality of each node (i.e. hashtag) u according to the formula:
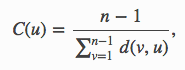
where d(v,u) is the shortest (i.e. geodesic) distance between nodes u and v, and n is the number of nodes in the community. This is effectively a measure of how close each hashtag is to all other hashtags in the community. After applying the formula, we can examine the hashtags in each community with the highest centrality (Figure 7). We can consider these to be the most representative of the community.

Labelling the most central hashtag for each community (i.e. column 0 above), the communities start to make sense, as we see in Figure 8.

To examine how these communities are connected, we can compute the betweenness centrality for each node v relative to the entire network according to the formula:

where σ(s, t) is the number of shortest paths between nodes s and t and σ(s, t|v) is the number of shortest paths between nodes s and t passing through node v. This effectively allows us to measure how important each node is in connecting communities. Labelling the hashtags with the highest betweenness (Figure 10), we can start to see the relationships between these communities.
We note that there is some overlap in the most central hashtags within each community to the hashtags with high betweenness – this makes sense, as the most central node in a community would likely be used to connect communities.
Now that we are able to better visualize the content of the network, we see that as we move from left to right along the u-shape (determined by the Fruchterman-Reingold force-directed algorithm), hashtags tend (roughly) towards conservative extremism. On the left we have the more anti-Trump and anti-Kavanaugh communities 5 and 7 (light-green and red), centered around #MuellerTime and #KavanaughAccuser. These connect to the pro-Kavanaugh and pro-Trump communities 3 and 4 (teal and dark-green), connected via the ubiquitous #MAGA (Trump’s 2016 campaign slogan). These communities branch off into various right-wing fringe ideologies, like #DeepState and #QAnon.
We can view the entire labelled network in Figure 11 (click to zoom in and read the labels).

Semantic Analysis
These ideological communities provide a clear means of identifying the latent topics discussed in tweets related to Kavanaugh’s confirmation. But how does the language of the tweets themselves relate to the content of these communities?
To answer this question, we can apply some basic principles of natural language processing to build a text classification model. We first use the hashtags comprising the network to map each tweet to one or more communities. Several tweets are associated with more than one community – this is equivalent to a tweet that spans more than one topic, which is not unexpected. We can perform some basic pre-processing to the corpus of tweets with the Python NLP library spaCy, removing stop words (very common and generally useless words) and lemmatizing (this is the process of converting each word to its “base form,” such that “studies” becomes “study” and “operational” becomes “operate”). We also remove hashtags used to map tweets to a community (since these would obviously be the most important words).
We can then apply a simple tf-idf weighting at the community level, treating all tweets associated with a given community as an entire document, such that words that appear in multiple tweets within a single community of tweets are weighted higher, and words that appear in multiple communities are weighted lower. From these weights, we can rank each word in a given community, such that the most important (i.e. unique and prevalent) words in each community are ranked highest. The top 5 words for each community are listed in Figure 12.
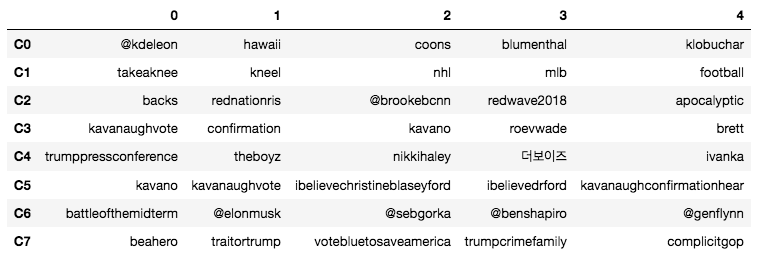
We observe many of the same trends we found purely from the hashtag network – communities 2 and 6 lean conservative while community 7 leans liberal. We see some overlap in communities 3 and 5. This is not surprising, as both of these communities refer explicitly to Kavanaugh’s confirmation. The Korean characters in community 4 is surprising. A quick Google search reveals this to be South Korean band “The Boyz,” featuring a singer named “Q” – an unfortunate association with the “QAnon” conspiracy theory.
Clearly, without the hashtags used to form these communities, the groups become much more difficult to define linguistically. To effectively evaluate their linguistic coherence, we can build a simple classification model to predict the communities associated with each tweet according to their semantic content.
Classification Modeling
To build our classification model, we perform our tf-idf weighting at the tweet level, treating each tweet as a separate document, such that words appearing multiple times within a single tweet are weighted higher (noting that this is rare, since tweets are short) and words appearing in a large number of tweets are weighted lower.
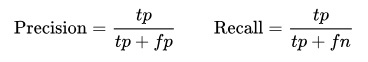
Since several tweets are associated with multiple communities due to their hashtags and the inherent ideological overlap of the hashtag communities, we cannot apply an out-of-the-box multinomial classification algorithm. Instead we apply a multi-label classification approach, training a unique binary classifier for each possible community. We note that this makes our sample sizes highly unbalanced, since only a small proportion of tweets are associated with each community. Because of this, we evaluate with precision and recall, defined by:
For computational speed and interpretability, we implement a simple logistic regression. Holding out a third of the tweets as a test set, we achieve the results shown in Figure 14.

We see the best performance with Community 1 and the worst performance with Community 3. This is unsurprising, as Community 3 is large and overlaps with several communities while Community 1 is small and well-defined. Taking a weighted average, we find a mean precision score of 0.83 and a mean recall score of 0.56. We can interpret these results as an indication that each of our classifiers is too “picky,” generally only classifying a tweet as belonging to a given community when its confidence is fairly high. For our application, this is not an undesirable result – most tweets in the Twitter universe don’t belong to any of these communities, so a selective classifier is appropriate.
While a more sophisticated algorithm (such as an LSTM neural network) might be able to achieve higher performance, our simple logistic regressions have the additional benefit of producing easily interpretable coefficients for every word. For each classifier, we can interpret the words with the largest coefficients as being the best indicators that a tweet belongs to the associated community. The top 5 words by coefficient for each classifier are shown in Figure 15.

The distinction between communities is now much clearer, especially in communities 3 and 5 explicitly referencing Kavanaugh with positive and negative sentiment, respectively.
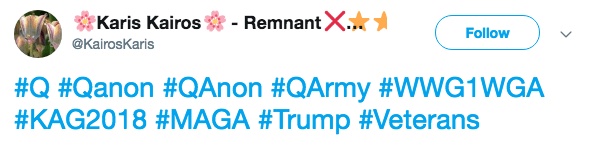
We note that many of the important words for each community are hashtags that were not included in our focal network. This is an unavoidable side-effect of our tweet corpus consisting entirely of tweets containing at least 1 hashtag. Indeed, a large proportion of tweets in our corpus consist almost entirely of several hashtags chained together – this is a common tactic employed by bots to try to get a topic to “trend,” as we see in the tweet in Figure 16 (classified as a propaganda bot by the tool botcheck.me).
Thus far we have operated on the assumption that our tweets were generated by real humans and are therefore representative of an authentic spectrum of social and political views. While this assumption is clearly false (in this study and nearly every other study involving tweet analysis), we can validate the robustness of our classifier by testing it with tweets outside of our original data set (Figure 17).
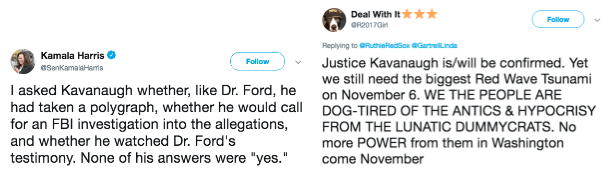
While both of the above tweets are predicted to be associated with Community 3 (due to their explicit reference to Kavanaugh), the tweet on the left is predicted to also be associated with Community 5 (the anti-Kavanaugh community) while the tweet on the right is predicted to be associated with Community 4 (the pro-Trump community).
A more sophisticated evaluation at a larger scale would involve applying our classifiers to a new corpus of tweets and manually validating their results, possibly incorporating some form of bot detection to filter out obvious fake tweets. However, for our purpose of understanding the semantic distinctions between the communities, our (admittedly naive) evaluation metrics are sufficient.
Next Steps
At this point, there are many directions we could go. We could leverage our NLP toolkit to identify the most representative tweets in each community. We could apply word2vec to compute semantic similarities across networks, or build a neural network to improve classification metrics. We could even go back to the beginning and apply the same methodology to a new corpus of tweets related to an entirely new topic.
Regardless of the future direction of this project, we’ve clearly demonstrated the effectiveness of a framework combining both network analysis and natural language processing to identify and semantically characterize ideological communities. Results from similar analyses could potentially have major ramifications on social media strategies, both personal and corporate. Next time you tweet with whatever hashtag is trending, consider the implications – what ideological community are you reinforcing?