As winter fades to spring here at Northwestern I look forward to warmer weather, longer days, and the return of baseball. I’m certainly interested in the mechanics of the game itself: earned runs, home runs, box scores and the pennant race. However, there’s a deeper and harder to describe feeling found in walking out the tunnel to see the field for the first time each spring, or in catching a game with an old friend on a summer afternoon. A certain fictional character may have said it best; while baseball may no longer be our most popular sport, it remains unquestionably the national pastime.
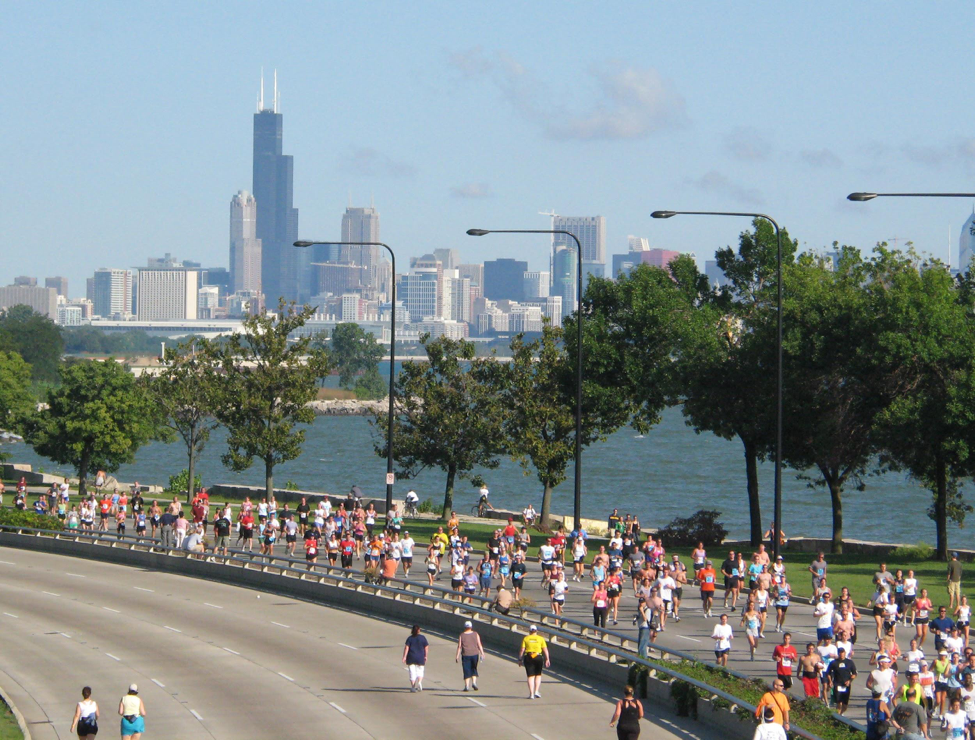
So, what better way to explore America and tap into our collective unconscious this summer than to make a pilgrimage to our nation’s green cathedrals: all 30 MLB stadiums. I keep this goal in mind whenever life takes me to a new city, and try to the catch the games when I can. However, the size of the league and the geography of the country it spans make this a difficult proposition indeed. For someone seeking to complete the journey in a single epic cross-country road trip, planning an efficient route is of paramount importance.
The task at hand can be conceptualized as an instance of the Traveling Salesman Problem. Easy to understand but hard (NP-Hard to be exact) to solve, the TSP is one of the most studied problems in optimization and theoretical computer science. It’s often used as a benchmark to test new algorithms and optimization techniques developed over time. The problem has spawned thousands of academic books, articles, and conference presentations, a great XKCD, and a terrible dramatic film. With even a modest list of cities to visit, the number of possible route permutations, or tours, becomes enormous. Brute force approaches are computationally inviable and no efficient polynomial-time exact solutions have yet been discovered.
In an attempt to tackle difficult problems like the TSP, researchers over the years have developed a wide variety of heuristic approaches. While not guaranteed to reach a global optimum, these techniques will return a near-optimal result with a limited amount of available time and resources. One of these heuristics, genetic algorithms, models problems as a biological evolutionary process. The algorithm iteratively generates new candidate solutions using the principals of natural selection, crossover/recombination, and genetic mutation first identified by Charles Darwin back in 1859.
Genetic algorithms have been successfully applied to a wide variety of contexts including engineering design, scheduling/routing, encryption, and, (fittingly) gene expression profiling. As a powerful problem-solving technique and a fascinating blend of real life and artificial intelligence, I wanted to see whether I could successfully implement a genetic algorithm to solve my own personal TSP: an efficient road trip to all of the MLB stadiums.
Natural selection requires a measure of quality or fitness[i] with which to evaluate candidate solutions, so the first step was figuring out how to calculate the total distance traveled for any given tour/route. Having the GPS coordinates of each stadium isn’t sufficient; roads between stadiums rarely travel in straight lines and the actual driving distance is more relevant for our journey. To that end, I used the Google Maps API to automatically calculate all 435 pairwise driving distances to within one meter of accuracy. This made it possible to sum up the total distance traveled, or assess the fitness, of any possible tour returned by the algorithm.
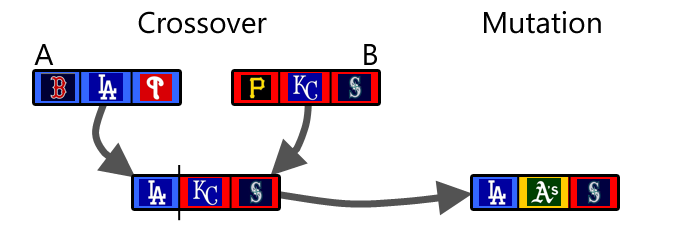
The process begins by creating an initial population[ii] of random trips. Parents[iii] for the next generation are then stochastically sampled (weighted by fitness) from the current population. To create new children[iv] from the selected parent tours I experimented with a number of genetic crossover strategies, but ultimately chose the edge recombination operator. To prevent the algorithm from getting trapped in a local minimum I introduced new genetic diversity by randomly mutating[v] a small proportion of the children in each generation. Finally, breaking faith with biology, I allowed the best solution from the current generation to pass unaltered into the next one, thus ensuring that solution quality could only improve over time. In other words: heroes get remembered, but legends never die.
After a bit of tinkering, the algorithm started to converge to near-optimal solutions with alarming speed. After roughly 100 generations the best solution was within 4% of the best global route found over the course of multiple longer runs with several different combinations of tuning parameters[vi]. To reach the best-known solution typically took around 1,000 iterations and just under 2 minutes of run-time. For the sake of context, enumerating and testing all 4.42e30 possible permutations would take roughly 1.19e19 years using my current laptop[vii], which is much longer than the current age of the universe (1.38e10).
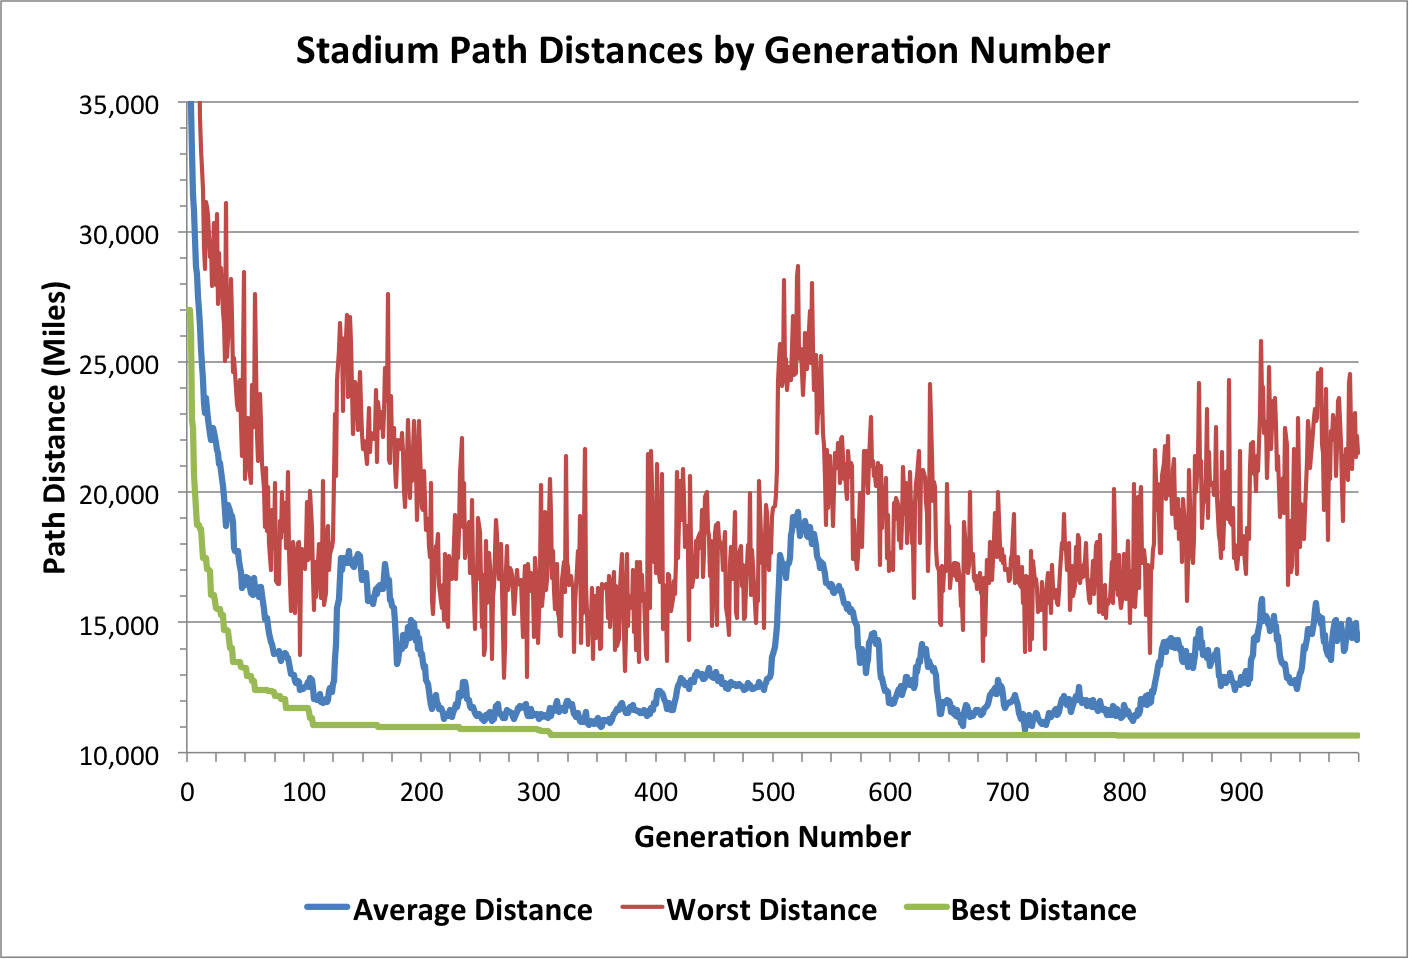
Looking at the algorithm’s results in each generation, there’s a quick initial drop in both the average and minimum path distance. After that, interesting spikes in average population distance emerge as the algorithm progresses over time. Perhaps certain deleterious random mutations ripple through the population very quickly and it takes a long time for those effects to be fully reversed. Overall performance seems to be a trade-off between fitness and diversity: sample freely (high diversity) and the algorithm may not progress to better solutions; sample narrowly (low diversity) and the algorithm may converge to a suboptimal solution and never traverse large regions of the solution space.
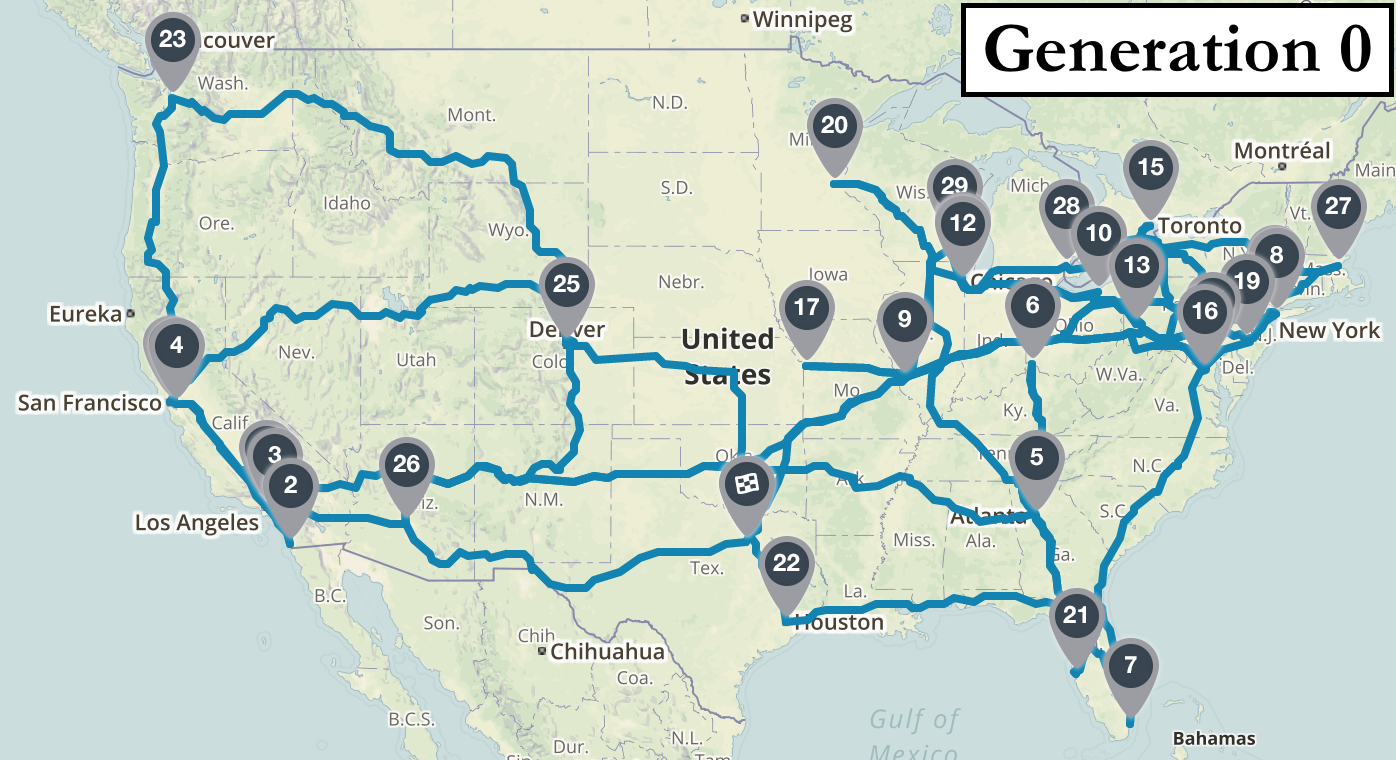
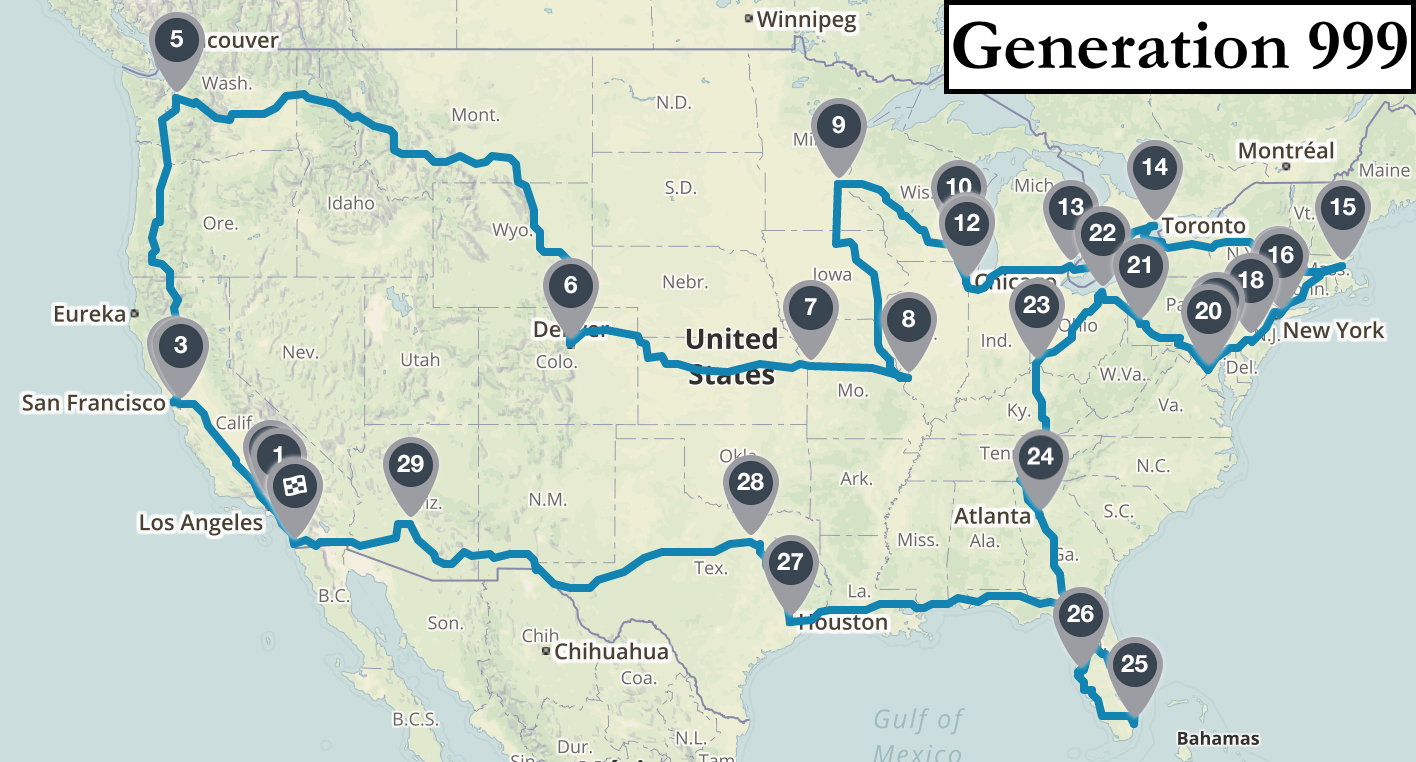
It’s perhaps more intuitive to visualize the algorithm’s progress by looking at the actual route maps identified in a few sample generations. The first map is a disaster: starting in Dallas it heads west to Los Angeles and then crosses the country to visit Atlanta without bothering to stop in Seattle, Denver, Kansas City, or St. Louis along the way. After 10 generations there are definite signs of progress: all west coast cities are visited before traveling to the northeast and then south in a rough regional order. After 100 iterations the route starts to look quite logical, with only a few short missteps (e.g. backtracking after Cincinnati and Boston). By iteration 1000 the algorithm is finding better routes than I could plan myself. As is the case with all search heuristics, I can’t prove that the algorithm’s best result is the global optimum. But looking at the final map it certainly passes the eye test for me.


According to experts, genetic algorithms tend to perform best in problem domains with complex solution landscapes (lots of local optima) where few context-specific shortcuts can be incorporated into the search. That seems to describe the actual biological processes of natural selection and evolution quite aptly as well. I’m sure I’ll be thinking about the intersection between life and artificial intelligence far into my own future. But for now, I’m just glad the algorithm found me a good route to all the stadiums so I can go watch some baseball!
I’ve posted all code, data, and images associated with this project to my GitHub account for those whose interest runs a bit deeper. Feel free to use and/or modify my algorithms to tackle your own optimization problems, or plan your own road trips, wherever they may lead.
[i] I defined the fitness function as the difference between the total distance of a tour and the maximum total distance with respect to all tours in the current population. Higher fitness values are better, and the same tour may receive different fitness scores in different generations depending on the rest of the population in each generation
[ii] An initial population of 100 random tours was generated to start the algorithm. Through replacement sampling and child generation the size of the population was held constant at 100 individuals in each generation throughout the algorithm’s run
[iii] Parents were sampled with replacement using a stochastic acceptance algorithm where individuals were randomly selected, but only accepted with probability = fitness/max(fitness) until the appropriate population size was reached
[iv] The edge recombination operator works by creating an edge list of connected nodes from both parents, and then iteratively selecting the nodes with the fewest connected edges themselves. I suggest heading over to Wikipedia to look at some pseudo-code if you’re interested in learning more
[v] I applied the displacement mutation operator to 5 percent of children in each generation, which means extracting a random-length sub-tour from a given child solution and inserting it back into a new random position within the tour.
[vi] I tested all combinations of two different crossover and two different mutation operators with varying population sizes and mutation rates to tune the algorithm
[vii] The symmetric TSP has (n-1)!/2 possible permutations. I ran a profiling test of how long my laptop took to enumerate and test 100,000 random tours, and then extrapolated out from there to get the estimate presented in the main text